Category: Downloads

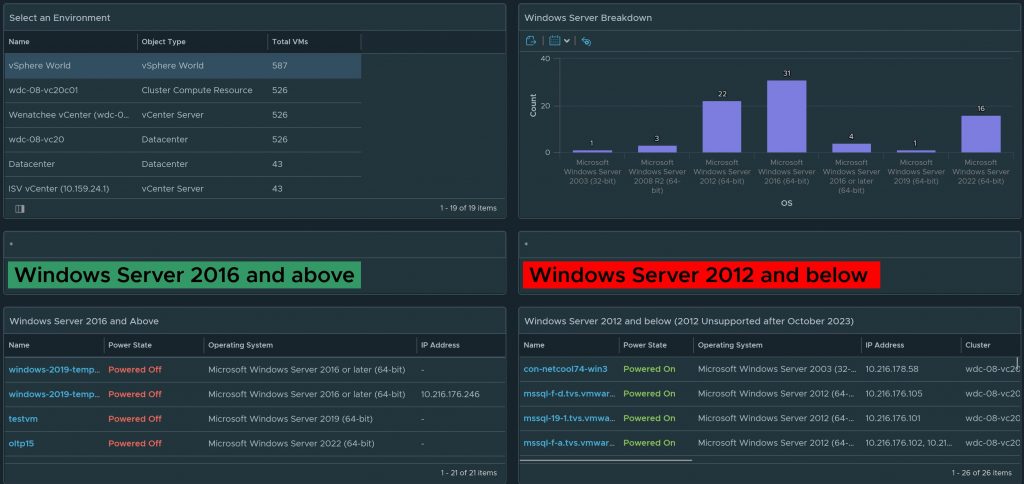
Download – Aria Operations Windows Server Checker Dashboard

Windows Server 2012 R2 has now reached end of life on October 2023. Which means free updates, bug fixes, and technical support for the OS has ended. Microsoft has allowed customers to purchase Extended Security Updates until 2026. With that being said, I have created this dashboard to easily check which environment still has Windows 2012 server and below in just one click of the button.

Download Dashboard here

https://developer.vmware.com/web/dp/samples?id=6554

User Guide

Select an Environment to do a Windows Check. Select vSphere World to search for all environments.

Get a nice breakdown of all Windows variants in the environment.

Anything in this column are Windows 2012 and below

Anything in this side are Windows 2016 and above

Download Dashboard here

https://developer.vmware.com/web/dp/samples?id=6554

twitterpinterestlinkedinmail


vROPS – Environment Performance Bench Marking Dashboard (Download)

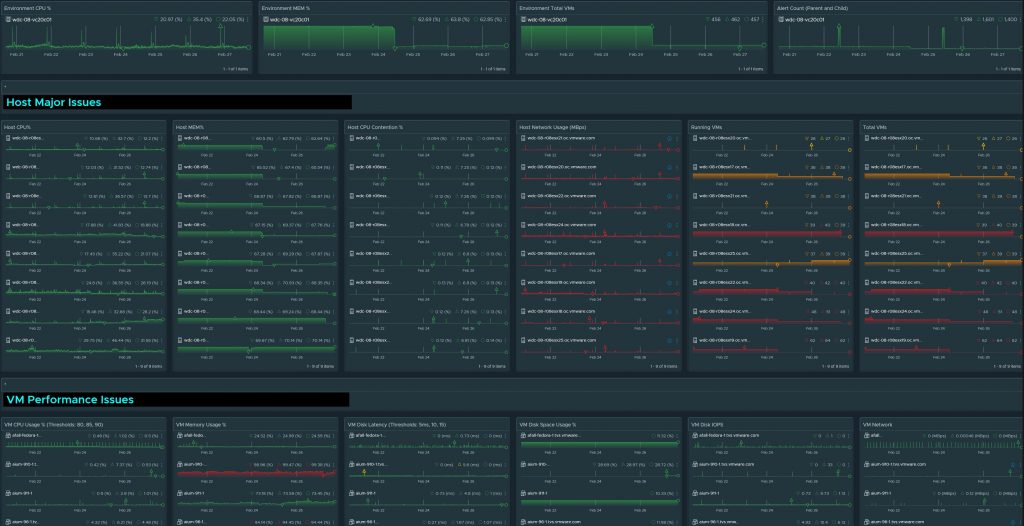
This must have dashboard will come in handy when you need to know how is your cluster, host, and virtual machines are performing in any point of time. For example if I do load testing on my cluster, how can I monitor the performance of all my Host, Virtual Machines, and overall health of my cluster during that time? This dashboards shows CPU performance, Memory performance, VM Growth, network usage, disk space growth, and more. Please see the youtube video below for full instructions on how to fully use the dashboard and some live examples on how it help solve one of my customer’s recurring issue.

Download here: https://developer.vmware.com/web/dp/samples?id=8089

Guide and demo on how to use the Dashboard

Installation Instructions:

Download the .json file from the above link and import into your dashboards. Then look for the dashboard named VMignite.com – Environment Benchmarking

twitterpinterestlinkedinmail


Log Insight – VM Monitoring Dashboard (Download)

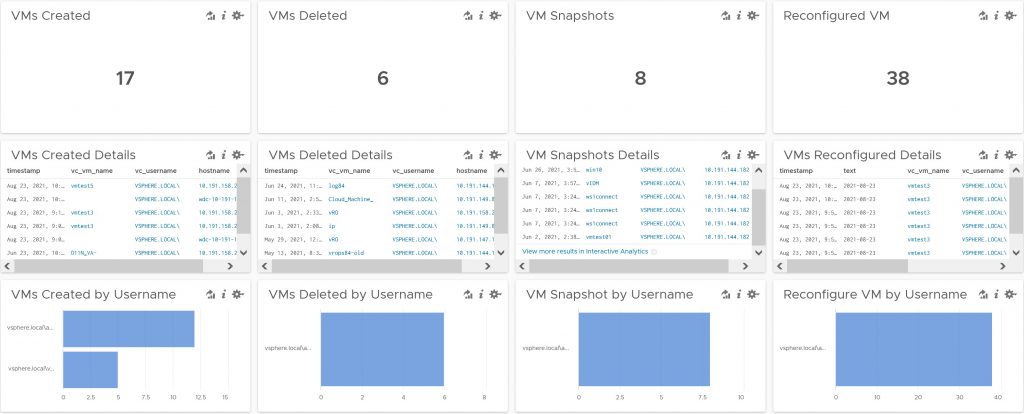
This is a must-have dashboard for anyone who wants to know who did what with my Virtual Machines. With this dashboard alone you will be able to know who created, deleted, modified, updated, power cycled, moved, remoted in, and exported a VM. It’s a 360 audit monitoring dashboard for everything Virtual Machines related. Details below.

What you will be able to monitor

  • VMs Created/Deleted
  • VMs Powered On/Off
  • VMs Rebooted
  • VMs Configured (Disk, Network, CPU, Memory)
  • VMs Renamed
  • VMs that got vMotioned
  • VMs that need Disk consolidation
  • Reservations
  • Limits
  • Snapshots
  • VMs Exported
  • VM Configuration Parameters changes
  • ISO Mount
  • VMs moved to folders
  • VM made to a template
  • Remote Consoled used to access a VM
  • VM Hot Add Modifications (CPU/Memory)
  • VM Versions updated
  • VMs Customized
  • VM HA event

Download Here: https://code.vmware.com/samples?id=7667

Install Guide

To import go to Content Packs > Import Dashboard. Import as Content Pack. Go to Dashboards to view the dashboard.

twitterpinterestlinkedinmail


vROPS 8.4+ – Executive Dashboard (Download)

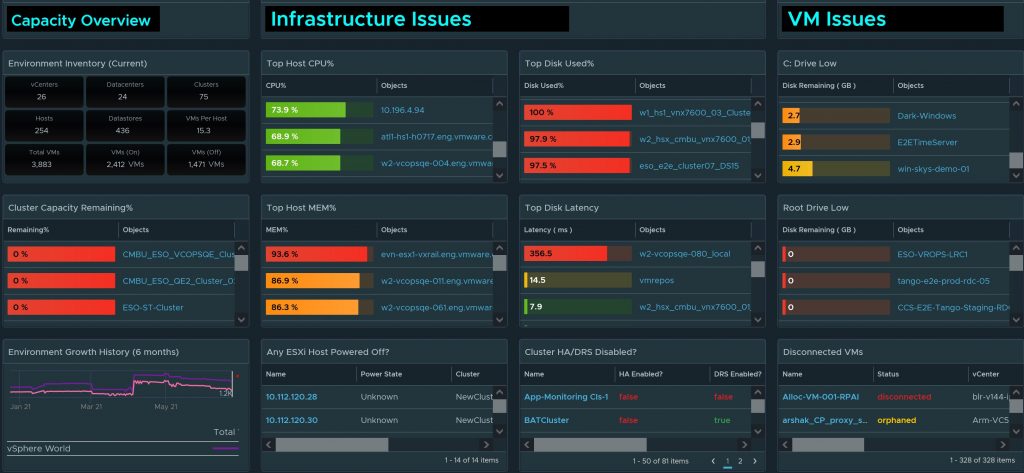
With the new features of 8.4, I was finally able to finish my Executive Dashboard the way I envisioned it. In one pane of glass, executives will be able to see how much capacity do they have left, what is my current inventory, how fast am I growing, does my current infrastructure have any cpu and/or memory bottlenecks, is my storage good in space and running at optimal speed, do I have any ESXi host down, is Cluster HA/DRS enabled, and does my VMs have enough resources to prevent any major outages. Read the user guide below to fully understand how to use the dashboard.  This dashboard could also be a 24/7 critical monitoring dashboard as well.  This dashboard should work with older versions as well, just won’t look as nice.

Download the Dashboard here: https://code.vmware.com/samples?id=7628

What the dashboard covers

Capacity

  1. Inventory
    1. vCenters, Host, Clusters
    2. Datastores
    3. VMs (Powered On, Powered Off, VM to host ratio)
  2. Cluster Capacity Remaining
  3. Capacity Growth in the past 6 months

Infrastructure Health

  1. Host high in CPU usage %
  2. Host high in Memory usage %
  3. Host that are down or powered off
  4. Datastores out of space
  5. Datastores with disk latency
  6. Clusters with HA/DRS turned Off

VM Health

  1. C: Drive low space
  2. Root Drive low space
  3. Disconnected VMs

Note:

  1. The entire dashboard auto refreshes every 5 minutes, so you always have the latest updates.  Therefore could also be used as a NOC dashboard
  2. You must be on vROPs 8.4 to have the best experience.  This dashboard should work with older versions as well, just won’t look as nice.
  3. You will need to enable these metrics to see C: Drive space low and Root drive space low.

    http://www.vmignite.com/2021/02/vrops-8-how-to-enable-hidden-metrics-and-properties/

  4. To remove any cluster, host, environments you don’t want to see in any of the widgets, just edit the widget and filter it out.
  5. Click on the expand button on any widget to see more values and to maximize the window

User Guide

View what you have in your entire environment

Capacity Remaining % is calculated by the lowest remaining value for CPU/Memory/Disk remaining. By default, it will use actual usage% for CPU/Memory/Disk. If you like you can adjust it to allocation model in the policies. You can also add a buffer as well to CPU/Memory/Disk. I set the thresholds for 20% for yellow, 15% for orange, and 10% for Red. This should all be green.

Measures VM growth in the past 6 months. Hover your mouse over the graph to see exact numbers of VMs at a certain time. Measures Total VMs and Running VMs

Make sure all ESXi Host utilization is green. Anything above 80% is yellow, 85% is amber, and 90% is red. Having high utilization may cause CPU/Memory bottlenecks. And if you reach the max, it may cause outages to VMs.

If the Power State is Unknown, this is bad. It means that the ESXi Host is either disconnected, orphaned, or not responding. This is most of the time not planned therefore you should address this immediately. If the Host is Powered Off, this is usually planned.

Do not let any Datastores be in the red zone. Even when you think it was planned and is under control, I have seen many customers fill up disk space which caused outages to many VMs that are on the same datastore. Thresholds are 85% yellow, 90% Orange, and 95% for red.

Disk latency can degrade performance for VMs on that datastore. Thresholds are 10ms for Yellow, 15ms for Orange, and >20ms for Red.

This widget will catch if one of the following is turned off Cluster HA or Cluster DRS. If this is blank, that means none are found which is a good thing

Having no space on the C: Drive for Windows OS and Root Drive for Linux OS can cause outages and degraded performance. Make sure no VMs get to that point. You should see values here no matter what. If you don’t you must enable the metrics in the policies. http://www.vmignite.com/2021/02/vrops-8-how-to-enable-hidden-metrics-and-properties/

Any VMs shown here should be addressed immediately on why they are not disconnected. If this is blank, that means none are found which is a good thing

Instructions on how to Import Dashboard

To import in version 7.0 and above

  1. First unzip the file you just downloaded, it will contain a dashboard and a view file
  2. Go to Dashboards > Actions > Manage Dashboards

  3. Hit the dropdown and select Import Dashboards. Import the Dashboard.zip file

  4. Next to go Views > Dropdown > Import. Import the View.zip file

  5. If you get any errors during the process, make sure to click overwrite before importing

twitterpinterestlinkedinmail


vROPS – Vmware Appliance Monitoring Dashboard

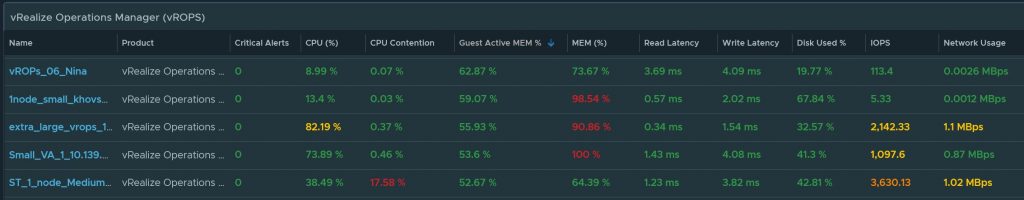
Monitor the performance and configuration of the following appliances: vCenter Servers, NSX, NSX-T, vRA, vROPS, Log Insight, Orchestrator, Life Cycle Manager, Network Insight (vRNI), Vmware SRM, vIDM, Air Watch, and Cloud Proxy appliances. Quickly compare performance stats such as CPU, Memory, Contention, Disk performance, and more. You can also compare configuration stats such as CPU, Memory, IP addresses, VM Tool versions, VM version, and more.

Download here: https://code.vmware.com/samples?id=7599

Monitors the following products

  • vCenter Server Appliance
  • NSX, NSX-T
  • vRA
  • vROPS
  • Log Insight
  • Orchestrator
  • Life Cycle Manager
  • Network Insight (vRNI)
  • Vmware SRM
  • vIDM
  • Air Watch
  • Cloud Proxy appliances

User Guide

Compare product to each other based on performance metrics (CPU, Memory, Disk Latency, IOPS, Contention, etc)

Scroll over to the right to get configuration metrics

Highlight any VM and scroll to the bottom to view alerts and properties of the VM

Instructions on how to Import Dashboard

To import in version 7.0 and above

  1. First unzip the file you just downloaded, it will contain a dashboard and a view file
  2. Go to Dashboards > Actions > Manage Dashboards

  3. Hit the dropdown and select Import Dashboards. Import the Dashboard.zip file

  4. Next to go Views > Dropdown > Import. Import the View.zip file

  5. If you get any errors during the process, make sure to click overwrite before importing

twitterpinterestlinkedinmail


vROPS – vSphere Health Checker Dashboard 2.0

First thank you everyone for making this the number 1 most downloaded dashboard on Vmware code. Also, a big thanks to the Vmware TAM community for all the positive feedback they have been telling me on how my website has helped their customers. The feedback will drive me to write even more useful content. With that being said, what better way to start than to share out my latest 2.0 version of the vSphere Health Check dashboard which has many major enhancements and has a greater amount of details than before. In this post I also wrote a full guide on how to resolve some of the main issues.

Download on VMware Code Exchange Here https://code.vmware.com/samples?id=5639#

Purpose:

Does a full health check of problems found in the environment (VMs, Host, Clusters, Datastores, vCenter).  This dashboard will help prevent issues before they happen (being proactive) by identifying everything wrong with your environment today so you can fix it before it causes a problem in the future.

What it monitors:

Monitor’s capacity issues, configuration issues, and performance bottlenecks (CPU, Memory, Contention, Disk Latency)

User Guide

Select any vCenter Servers, Datacenter, Clusters, or entire environment (vSphere World) to do a complete health check on it

You can also use the search box to search what you are looking for

Any of these widgets can be easily exported to excel. They are also report ready, meaning you can add any of the filters I’ve created to a custom report.

Monitoring vROPS

Monitor the health of all vROPS nodes. Make sure the vROPs DB Usage % doesn’t reach over 90%. You will need to add more disk to vROPS if this gets high. It will also monitor any adapters that are down and any vROPS alerts.

Monitoring vCenter

This monitors vCenter for any disk space issues and vCenter alerts.

Monitoring Virtual Machines

When monitoring high CPU and high memory usage. It is important to see the 7-day average as well. If the average is high, then the VM pretty much needs more resources immediately.

If any VM has high contention, CPU ready time, CPU Co-stop, or memory ballooning. It basically means something is constraining the VM from getting the resources it needs. There is no one simple way to fix this. These are the checks I would perform to troubleshoot the issue.

  • Check to see if there are any memory or cpu limits on the VM
  • Check to see if the VM has an alert that states that the Host Power settings is causing contention. ESXi Host that are not set to high performance in the power settings usually causes contention
  • Check if the VM is on a highly utilized ESXi Host
  • Check if the VM is on a resource pool that has resource limits assigned
  • Check to see if the VM has enough CPU and/or memory resources. Notice how this is the last step. This should be your last resort

If the VM Disk latency is high, this means your disk performance is suffering.  Check to see if the datastore that the VM is on has high latency as well. If the datastore is overworked, it will cause latency on other VMs that are hosted by it as well. Another good way to find out if it’s the VM or the datastore that is causing the latency is by doing a storage vMotion to an isolated datastore. If the latency drops down dramatically you will know it was the datastore that caused it

For VM Disk IOPS and Network Usage notice how this widget says awareness only. High Disk IOPs doesn’t mean there is a disk performance issue. It just means that the VM has lots of disk activity. A typical VM usually doesn’t have more than 1000 IOPS. A busy VM such as heavy Database servers, File Servers, Exchange Server, etc will have IOPS in the range of 1000-8000 depending how busy it is. If any VMs that has high IOPS or high network usage that looks off to you should be investigated. Anything over 10,000 IOPS is extremely rare and should be investigated immediately. None of the Fortune 500 companies that I know of has a VM that is higher than 10,000 IOPS.

If I see any VM that has 0 capacity on the C: Drive or the Root Drive. The performance of the VM will suffer dramatically until you add more partition space. For snapshots, most of the time snapshots should not be older than 7 days.

Note: If this is blank you will need to enable the Guest File Free metric for VMs in all the active policies. This is not enabled by default in vROPS.  Use this guide to enable this metric.  http://www.vmignite.com/2021/02/vrops-8-how-to-enable-hidden-metrics-and-properties/

If you see any type of VM limits this is not a good sign. A limit on a VM basically means the VM won’t perform more than what the limit is set to. For example, the VM I highlighted below has a memory limit of 8GB. However, the configured memory is set to 24GB. Even thou the VM has 24GB of memory configured, it will only be consuming 8GB of it because of the 8GB limit set on the VM. You won’t get full performance until you remove the limit of the VM in vCenter. Hopefully you now understand why Limits are not good at all for any reason.

Monitoring Clusters

Cluster HA and DRS in mostly all cases should always be enabled. A large company could have 100s of clusters, it will be quite a nightmarish task to check all these manually. Luckily, I got you covered as all you need to do is look at my dashboard. Another thing to look for is DRS Policies not set to automatic. Although DRS is enabled, if it is not set to automatic, resource balancing will not automatically occur. This setting is often overlooked.

Monitoring Datastores

Any datastore that has high latency is not a good sign, most of the time it will affect the VM performance as well. Do not let your datastores run more than 80% utilized. A datastore that is out of space will cause outages.

Monitoring ESXi Host

This is one of my favorite widgets because it reports back on physical ESXi host failures that vCenter detects. Customers have told me that this some times detects issues that even the vendor software didn’t even detect.

Download on VMware Code Exchange Here https://code.vmware.com/samples?id=5639#

Instructions on how to Import Dashboard

To import in version 7.0 and above

  1. First unzip the file you just downloaded, it will contain a dashboard and a view file
  2. Go to Dashboards > Actions > Manage Dashboards

  3. Hit the dropdown and select Import Dashboards. Import the Dashboard.zip file

  4. Next to go Views > Dropdown > Import. Import the View.zip file

  5. If you get any errors during the process, make sure to click overwrite before importing

twitterpinterestlinkedinmail


Download – vROPS Complete 360 Inventory Dashboard

The new vCenter Inventory is even more complete than the last one. In one click you can get a complete inventory of your environment and performance stats. I’ve enhanced this dashboard with dozens of more metrics, features, and inventory objects collected in this new update. Also newly updated is the ability to highlight any object (vCenter, Host, Clusters, etc) and it will update the list to reflect related objects to it (super useful for unlimited drilldowns capability). Read the full guide below to see how detailed this dashboard is.

Download here https://code.vmware.com/samples?id=5629#

What it provides in one click?

  • Count of how many objects of each type in the environment (folders, switches, VMs, etc)
  • Environment Capacity Total, capacity used, and capacity provisioned
  • Chart on all Physical Host types
  • Chart on all Operating Systems
  • Chart on all on all ESXi Host versions
  • Graph on VM memory configurations
  • Charts on Cluster HA, DRS, Admission Control, and DRS Policy settings
  • Latest VMs, Host, Datastore, vCenter, and Clusters added in the environment
  • Complete vCenter Inventory in a list view with performance metrics and properties
    • vCenters
    • Datacenters
    • Clusters
    • Hosts
    • VMs
    • Datastores
    • vDS Switches
    • Port Groups
    • Datastore Clusters
    • Resource Pools

User Guide

Select any vCenter or all of them combine (vSphere World). Also shows you inventory and performance stats

Get an object count of everything in that environment

Get Inventory and capacity details down to the used, total provisioned level for your selected environment

Get a great overview of what is in your environment. What are all the Physical Servers models? Which server model is the majority? Also shows ESXi Host versions, Operating System, and VM Memory configured.

Clicking on the pie chart will show you what those objects are on the right side

Shows latest Objects added to the environment (VMs, Host, Clusters, Datastores)

Shows List of Inventory along with useful performance metrics

Can instantly export most of the content to Excel by just clicking on the export button

Highlighting anything in the inventory will update the related objects below it. For example I highlighted a Cluster and it instantly updated the Host that are on it below. (Note: Do not click on the object name but highlight the metrics on the right side of it to highlight it.)

Download here https://code.vmware.com/samples?id=5629#twitterpinterestlinkedinmail


Download – VM Uptime Dashboard for vROPS 8.2+

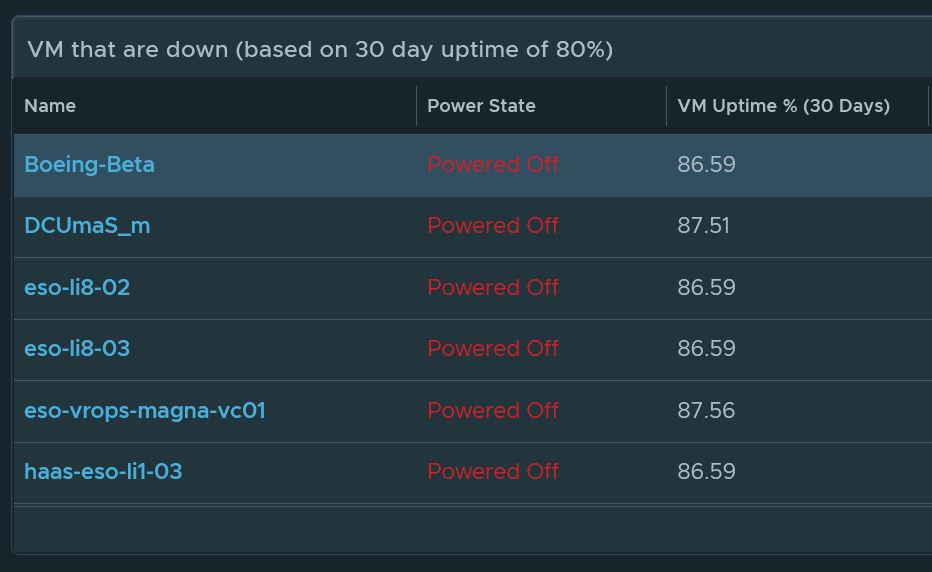
The VM uptime dashboard will keep track of any VMs that are currently down but has an uptime of more than 80% of the time for the last 30 days. A production VM should be up a majority of the time, therefore giving an uptime of over 80% for 30 days will eliminate a lot of VMs that are used for temporary testing, powered off majority of the time, VM templates, etc.

(Note you must have vROPS 8.2 for this to work)

Instructions

  1. You will need to install and active the uptime supermetric which you can download here first https://code.vmware.com/samples?id=7421
  2. Next download and install the dashboard and view here https://code.vmware.com/samples?id=7476

User Guide

  1. If any production VMs are down you will see it listed here. As you can see in the sample, the VMs are currently in a Powered Off State and the VM has a high uptime in the last 30 days.
  2. Select any of the VMs and you will see the uptime history in the graph below it. Use your mouse to hover when it went down to see exact dates and time when it went down.

How to Install the dashboard

To import in version 7.0 and above

  1. First unzip the file you just downloaded, it will contain a dashboard and a view file
  2. Go to Dashboards > Actions > Manage Dashboards

  3. Hit the dropdown and select Import Dashboards. Import the Dashboard.zip file

  4. Next to go Views > Dropdown > Import. Import the View.zip file

twitterpinterestlinkedinmail


vROPS Super Metric – Virtual Machine Uptime

Personally, Virtual Machine uptime is the hardest metric to calculate and create by far. Luckily, my co-worker Iwan has already created one using his own logic. All I had to do was update it and improve it as needed. Rather than rewrite everything he wrote; you can read a full explanation of how the metrics work here: http://virtual-red-dot.info/vm-availability-monitoring/

You can download the new version that I modified below. In my next post, I will show you how to monitor and get an alert on a Virtual Machine going down using this metric in vROPS 8.2. If you want this capability, it is best to download and activate this supermetric now.

https://code.vmware.com/samples?id=7421twitterpinterestlinkedinmail


Download – vROPS Cluster Uptime Checker Dashboard

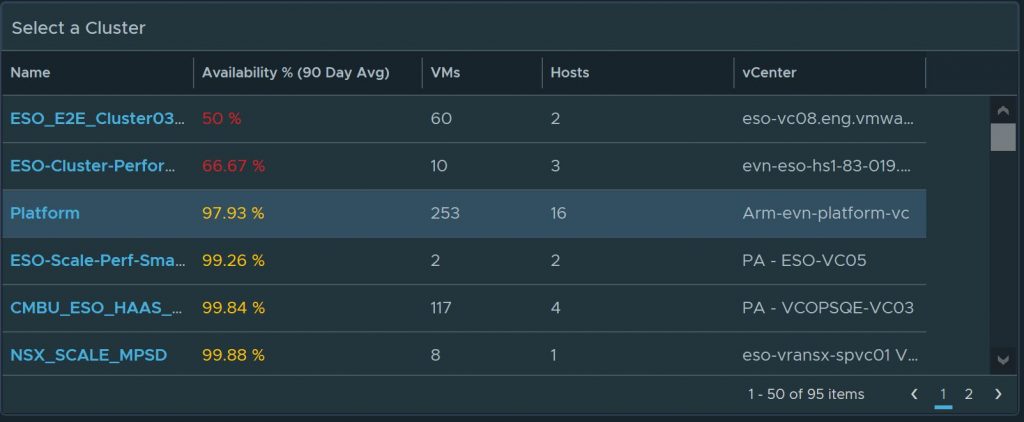
Management is always worrying about infrastructure uptime. They usually want to know if there were any unplanned outages in the last week? What about the past 30/60/90 days? And if there were any outages, what caused it? To answer these questions I have created the Cluster Uptime Checker dashboard. This dashboard will tell you the uptime % of all your clusters in the past 3 months by default. If the uptime is not 100% for the entire cluster, you can use the dashboard to identify which ESXi host were down for the past 7 days and even 30/60/90 days. You can also use the dashboard to identify if the ESXi host was down because of hardware failures, network failures, ip conflict, etc. Below is a guide on how to use the dashboard.

Download Here: https://code.vmware.com/samples?id=7375

Clearly view which vCenter Cluster had an ESXi Host outage in the past 3 months. Just select the Cluster to view which ESXi Host were having outages and when exactly did it happen. (Note: do not click on the name of the Cluster, click on the availability numbers to select it)

The next widget clearly shows I had at least one host outage sometime in April and in May.

The next widgets show me which Host were down in the past 7/30/60/90 days. As you can see from the diagram, there were uptime issues in the past 60 and 90 days caused by two ESXi Host. Select the Host from the list to see details on why it was down.

After selecting an ESXi Host, I can see see when the host was down. I can hover over with my mouse on the graph to get the exact date and time.

The Alerts widgets shows active and past alerts. I can quickly see there are storage sensor problems and a possible Physical NIC was down that could has casued the outage.

As an added bonus I even included all the properties of the ESXi Host so I can know which model, BIOS information, settings, etc

To import in version 7.0 and above

  1. First unzip the file you just downloaded, it will contain a dashboard and a view file
  2. Go to Dashboards > Actions > Manage Dashboards

  3. Hit the dropdown and select Import Dashboards. Import the Dashboard.zip file

  4. Next to go Views > Dropdown > Import. Import the View.zip file

twitterpinterestlinkedinmail


vROPS – Core Dashboard (vCenter and vROPS Monitoring)

This is a must-have dashboard for those who wish to monitor vCenter Appliance partition disk space usage and vROPs disk space usage filling up as well. Both are critical as it can lead to an outage on both products. This dashboard covers the following.

  1. Are my vCenter Appliance Disk partitions filling up?
  2. Are all my vROPS adapters collecting?
  3. Is my vROPS out of space?
  4. vCenter Alerts (10+ Alerts)
  5. vROPS Alerts (30+ Alerts)

Below is a user guide and a walk through of the dashboard. The dashboard auto refreshes each widget every 5 minutes.

This Dashboard is not integrated with the Healthchecker Dashboard.  Download below

https://code.vmware.com/samples?id=5639#

See what adapters are not collecting. This widget monitors all configured adapters being collected by vROPS

Monitor vROPS Disk space issues. As some of you are already aware, if you run out of space, vROPS will go down.

Monitor over 30 alerts for vROPS. In the below example, it even detects memory swapping.

Monitors all partitions of the vCenter Appliance and sorted by the highest disk usage %. This alone makes this dashboard a must-have dashboard

Monitors over 10+ Alerts for vCenter Server

This widget monitors Certificates for vCenter and other products as well

To import in version 7.0 and above

  1. First unzip the file you just downloaded, it will contain a dashboard and a view file
  2. Go to Dashboards > Actions > Manage Dashboards

  3. Hit the dropdown and select Import Dashboards. Import the Dashboard.zip file

  4. Next to go Views > Dropdown > Import. Import the View.zip file

twitterpinterestlinkedinmail


Download – Windows Server Checker Dashboard for vROPS 7.0+

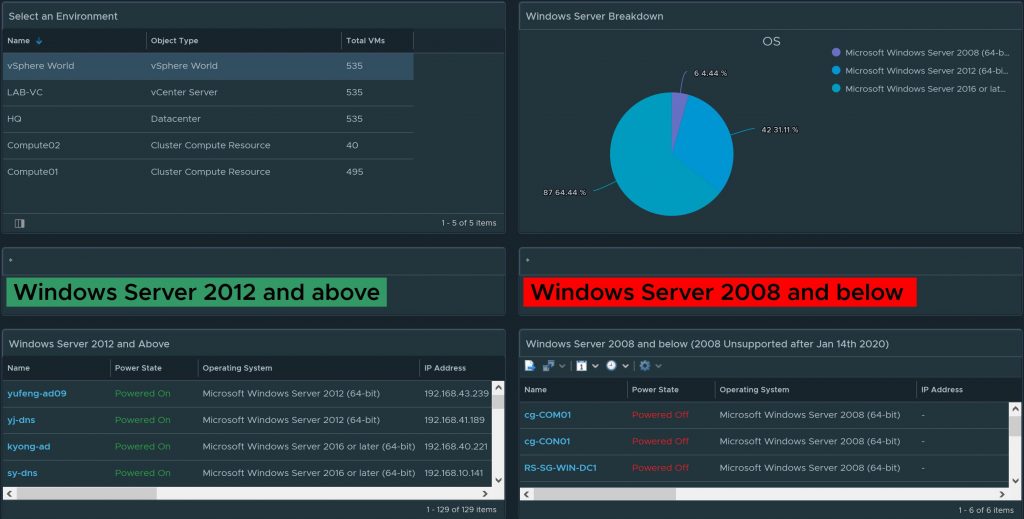
On January 14th 2020 Microsoft will be officially ending its support for Windows 2008 Servers. In this post I will share you an awesome dashboard that will instantly check for how many servers that are running version 2008 and below. Below is a handy user guide. Works for version vROPS 7.0 and above.

Download it here
https://code.vmware.com/samples?id=6554

Select your Environment (Cluster, vCenter, Datacenter) or select vSphere World for everything

View a Pie Chart Breakdown of various Windows Server versions in your environment

Instantly identify which Windows Servers are 2008 and below and which are above. As you can see in this example we have 129 Window Servers that are version 2012 and above and six 2008 Servers.

Scroll over to see which Clusters and Host they belong to and to see more properties of the VM

Instantly export it to excel as needed

Note: Once you finish upgrading the Windows Server 2008 VM. While it is still Powered Off go to Edit Settings > VM Options > General Options and change the the Guess OS Version to the same version you just upgraded to.  For example: Windows Server 2016. This will update the VM and also update the dashboard as well

Download it here
https://code.vmware.com/samples?id=6554


To import in version 7.0 and above

  1. First unzip the file you just downloaded, it will contain a dashboard and a view file
  2. Go to Dashboards > Actions > Manage Dashboards

  3. Hit the dropdown and select Import Dashboards. Import the Dashboard.zip file

  4. Next to go Views > Dropdown > Import. Import the View.zip file

twitterpinterestlinkedinmail


Download – Vmware Inventory Dashboard for vROPS 7+

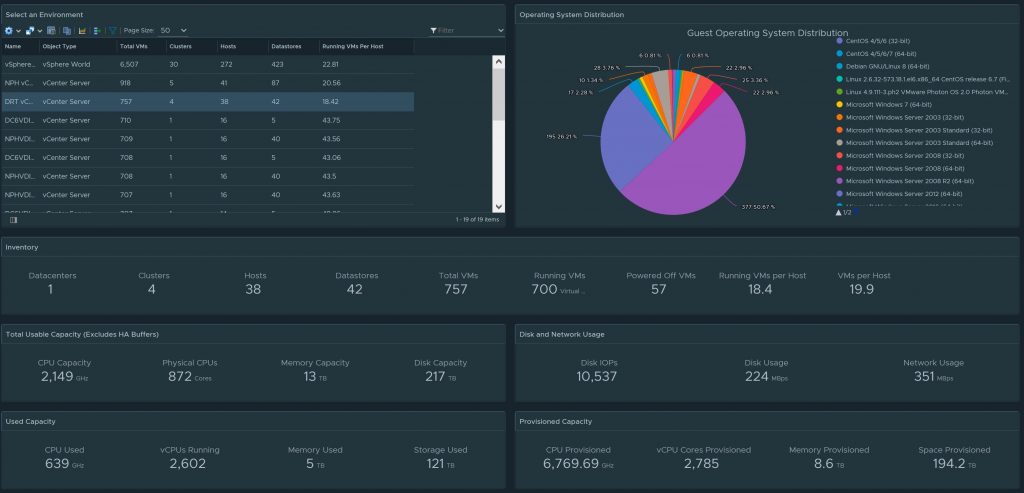
Has your manager ever ask how much capacity is being used in a particular vCenter or your entire environment? This dashboard is now upgraded to include all this information and more. The dashboard shows complete inventory of your environment (vCenter, Hosts, Clustes, VMs, etc), how much capacity you have in total, how much you are actually using, and how much is configured. It breaks down in greater details of what those Hosts, VMs, Clusters, etc are. It also shows you the latest Host, VMs, Clusters, etc that were added to the environment.

Download for vROPs 7.0 and above only!

Download here https://code.vmware.com/samples?id=5629#

Nice pie chart that provides great insight of how your Operating Systems are being distributed in your environment. In this example I can see 50% is running Windows Server 2008 R2 64bit. Coming in second is Windows Server 2012 64-bit

I can click on any part of the Pie chart and it will instantly display which VMs are they

Click on the Export Icon and I can export a breakdown in Excel form

Next section shows me the entire inventory, how much total capacity do I have, how much capacity am I using, and how much is configured. Notice I even included Network Usage and IOPs

All Performance Metrics are color coded and each can be sorted

VMs

Click on the Export button to export to Excel

export

Scroll to the bottom to see Total and AveragestotAL


View the latest VMs, Datastores, Hosts, and vCenters collected

latest


To import in version 7.0 and above

  1. First unzip the file you just downloaded, it will contain a dashboard and a view file
  2. Go to Dashboards > Actions > Manage Dashboards

  3. Hit the dropdown and select Import Dashboards. Import the Dashboard.zip file

  4. Next to go Views > Dropdown > Import. Import the View.zip file

twitterpinterestlinkedinmail


Download – vSphere Complete Health Check Dashboard for vROPS 7+

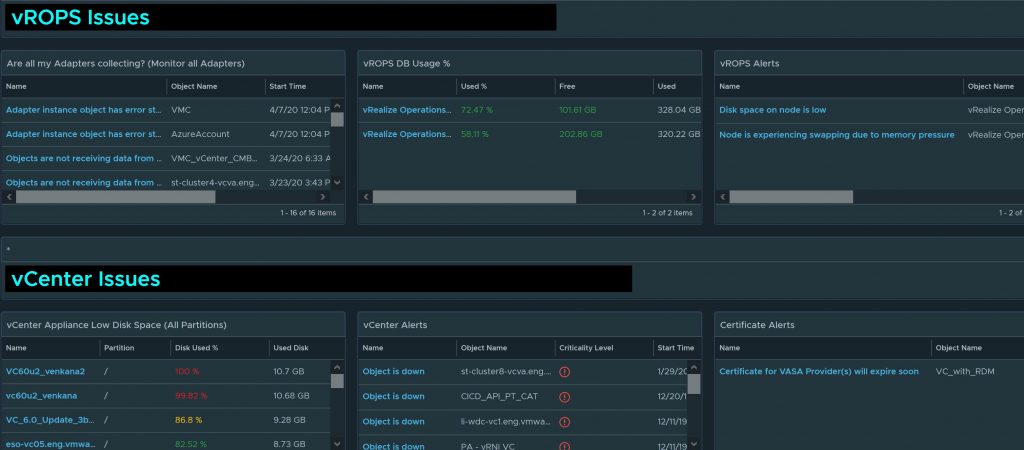
One click and you can analyze everything wrong with your current vCenter Environment! From physical hardware issues, VM performance and configurations issues, Cluster Configurations issues, Datastore problems, ESXi Host performance, security, and configurations issues. Supports up to all levels of your virtual environment (vCenter, Datacenter, Clusters, and entire environment). This is one dashboard everyone must have! Read more details of this dashboard below


Download on VMware Code Exchange Here https://code.vmware.com/samples?id=5639#


Check the health of any vCenter Servers, Datacenter, Clusters, or entire environment (vSphere World)


Type in what you are looking for easy searching


Export anything you like to an Excel File for easy emailing. Also any of these widgets can be added to a report!


View VM Performance, Configuration, and Capacity Issues.


See the Weekly Averages to give you better insight on how longs it has been happening


Checks to make sure all your clusters setup for HA, DRS, and Admission Control. Also checks for Storage performance and capacity issues


Checks for over 18 Physical Host Issues. Also checks for ESXi Configuration, security, and performance problems such as HA disabled on individual host, Hyper-Threading not enabled, NTP, and more.

Download on VMware Code Exchange Here https://code.vmware.com/samples?id=5639#


To import in version 7.0 and above

  1. First unzip the file you just downloaded, it will contain a dashboard and and two view files
  2. Go to Dashboards > Actions > Manage Dashboards

  3. Hit the dropdown and select Import Dashboards. Import the Dashboard.zip file

  4. Next to go Views > Dropdown > Import. Import the View.zip file one by one.  Overwrite as needed


twitterpinterestlinkedinmail


Download – vROPS Hardware and configuration issues dashboard

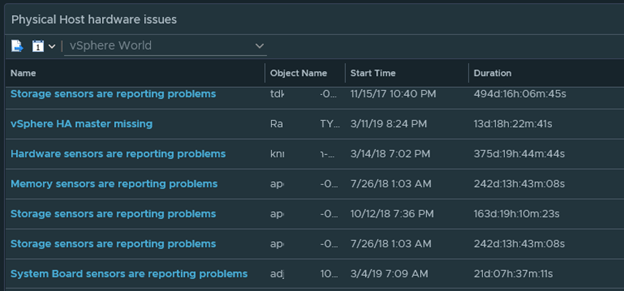
The purpose of this dashboard is to capture all the important issues with Physical Host Hardware, host network availability, storage availability, and vSwitch configuration issues. Out of the box, vROPS captures all these issues using alerts definitions. This dashboard filters these alerts and turn the data into something a lot more useful and way easier to manage. A guide on how I created this dashboard can be found here. Below is a guide on how to best use this dashboard


All physical host hardware issues are detected here. View memory, hardware, fan, temperature, voltage, system board issues, and more. Shows when it started and how long it has been happening.


Is the redundant networks on your host working properly? Are the Host networks on the host configured correctly? This part of the dashboards shows it all.


Storage configured correctly? I wouldn’t wait till an outage to find out.


This part of the dashboards checks if all your MTU and VLANs are configured correctly


Download the dashboard here >>>> Hardware Alerts Issues (1591 downloads )


You may also want to check out these other dashboards these other related dashboards uploaded by my coworker Joe Tietz.


To import in version 7.0 and above

  1. First unzip the file you just downloaded, it will contain a dashboard and a view file
  2. Go to Dashboards > Actions > Manage Dashboards

  3. Hit the dropdown and select Import Dashboards. Import the Dashboard.zip file

  4. Next to go Views > Dropdown > Import. Import the View.zip file


 twitterpinterestlinkedinmail