One click and you can analyze everything wrong with your current vCenter Environment! From physical hardware issues, VM performance and configurations issues, Cluster Configurations issues, Datastore problems, ESXi Host performance, security, and configurations issues. Supports up to all levels of your virtual environment (vCenter, Datacenter, Clusters, and entire environment). This is one dashboard everyone must have! Read more details of this dashboard below
Download on VMware Code Exchange Here https://code.vmware.com/samples?id=5639#
Check the health of any vCenter Servers, Datacenter, Clusters, or entire environment (vSphere World)

Type in what you are looking for easy searching

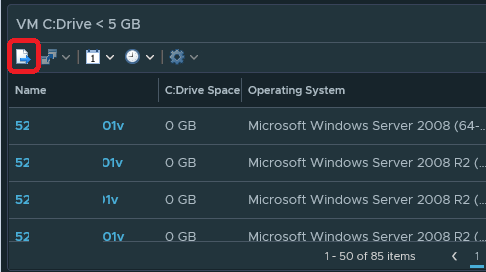
Export anything you like to an Excel File for easy emailing. Also any of these widgets can be added to a report!
View VM Performance, Configuration, and Capacity Issues. 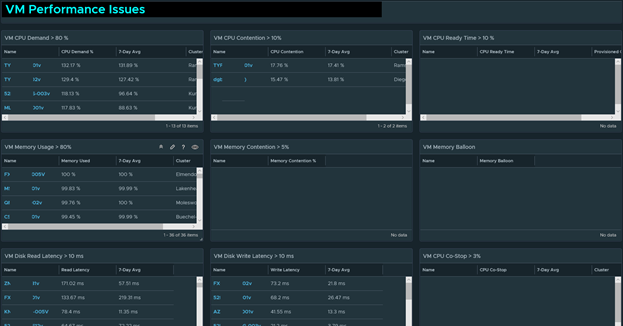
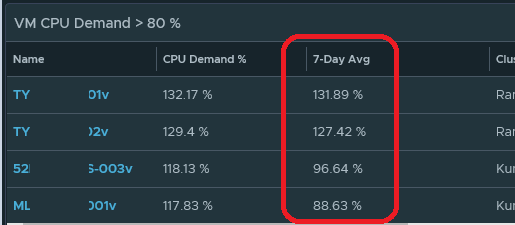
See the Weekly Averages to give you better insight on how longs it has been happening
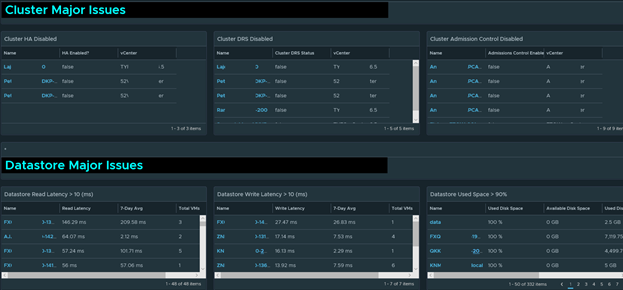
Checks to make sure all your clusters setup for HA, DRS, and Admission Control. Also checks for Storage performance and capacity issues
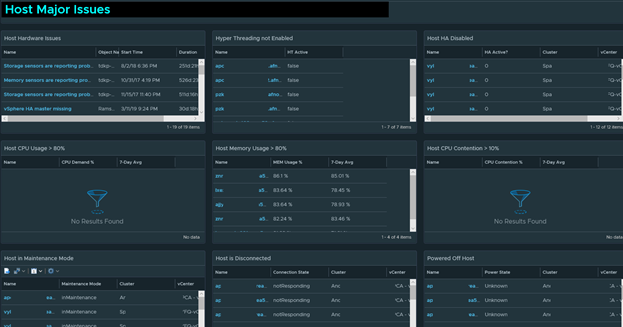
Checks for over 18 Physical Host Issues. Also checks for ESXi Configuration, security, and performance problems such as HA disabled on individual host, Hyper-Threading not enabled, NTP, and more.
Download on VMware Code Exchange Here https://code.vmware.com/samples?id=5639#
To import in version 7.0 and above
-
First unzip the file you just downloaded, it will contain a dashboard and and two view files
-
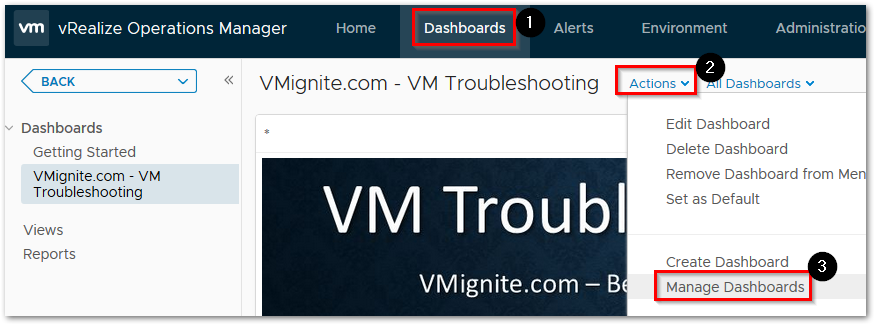
Go to Dashboards > Actions > Manage Dashboards
-
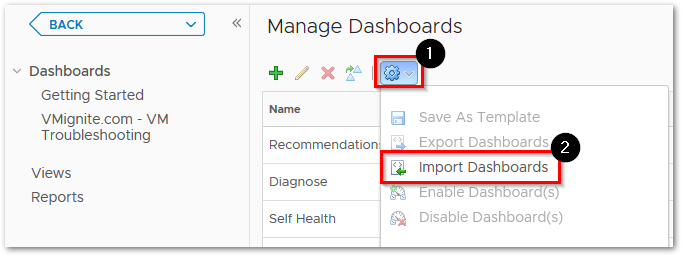
Hit the dropdown and select Import Dashboards. Import the Dashboard.zip file
-
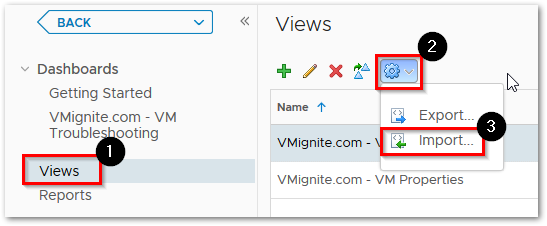
Next to go Views > Dropdown > Import. Import the View.zip file one by one. Overwrite as needed
