New Links to all VMignite Free Dashboards
With the new Broadcom URL transfers, you can use the link below to download all my dashboards. Currently my website […]
With the new Broadcom URL transfers, you can use the link below to download all my dashboards. Currently my website […]
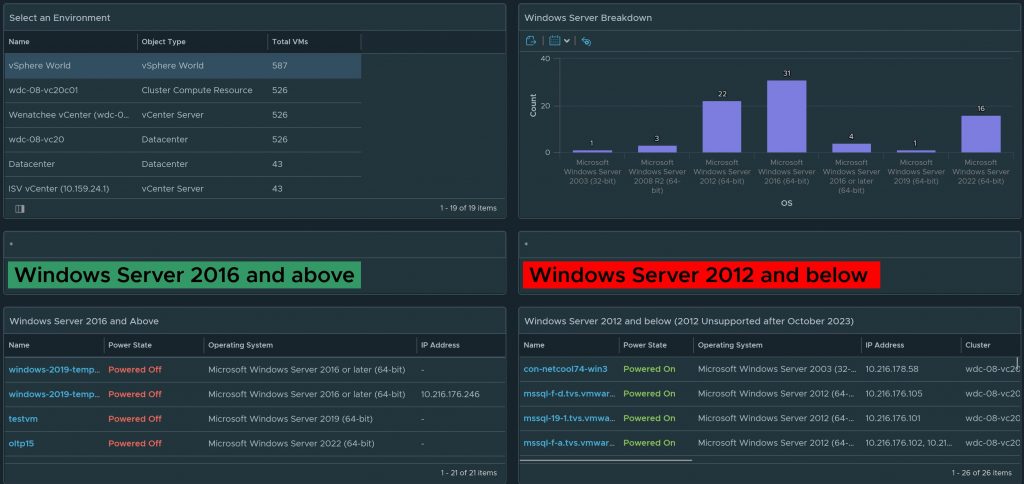
Windows Server 2012 R2 has now reached end of life on October 2023. Which means free updates, bug fixes, and
I always tell my customers that one of the hardest metrics to measure by far is Virtual Machine uptime. The

Although I spend endless hours testing features and perfecting day 2 operations as much as possible. I also spend some

In this video tutorial I will walk you through how to create a multi-condition alert, an alert based on a
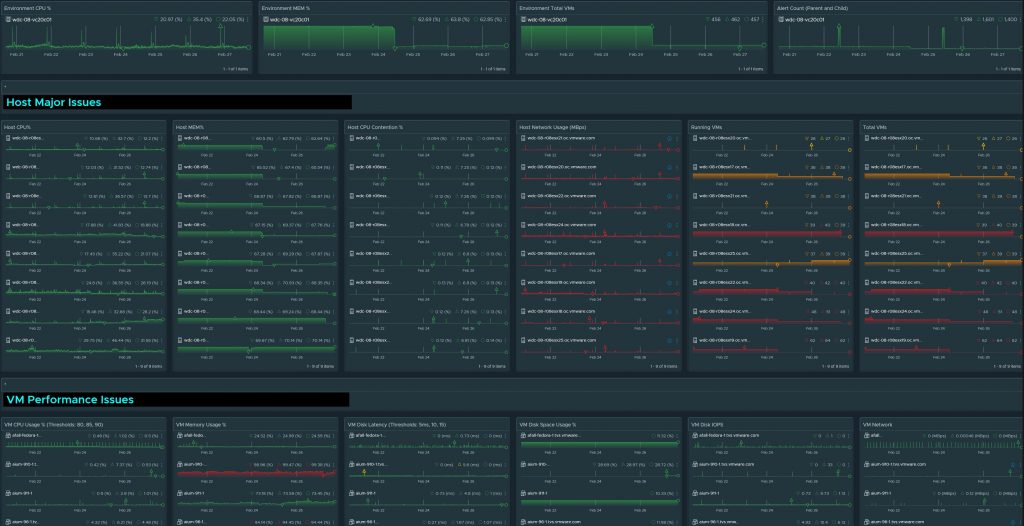
This must have dashboard will come in handy when you need to know how is your cluster, host, and virtual

Even after 15 years in the Virtual space, my friends and family still don’t understand what I do when I
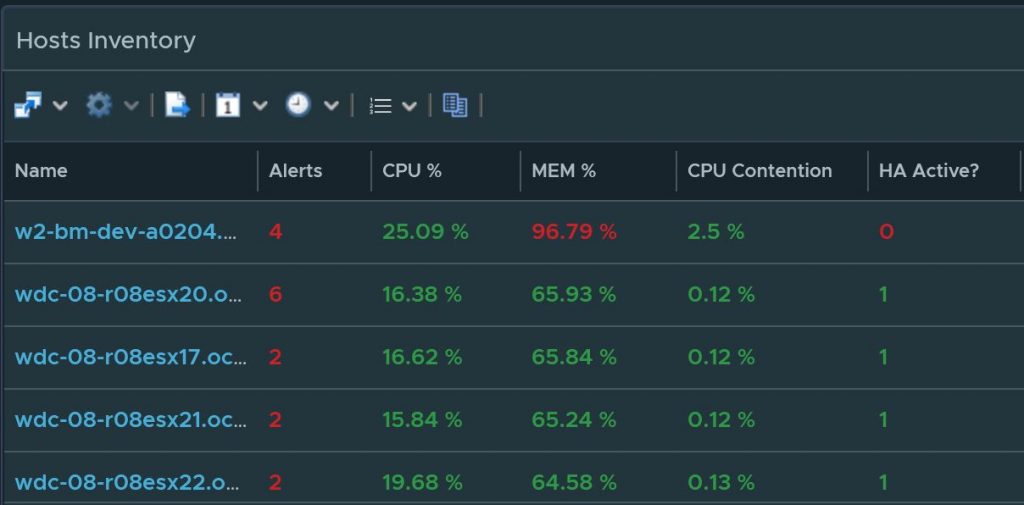
Create a dashboard and report using the most popular widget by far, the list view. Mastering the list view widget

New in vROPS 8.10 is the ability to filter deleted objects such as Virtual Machines, Host, datastores, etc. In this

The highest level of monitoring in my opinion is automation. That is when you are leveraging monitoring tools to automate

Two must have dashboards are now updated and better than ever before. The Appliance Dashboard is what I personally used

In this post I will show you how to monitor over 40 out of the box services using no credentials
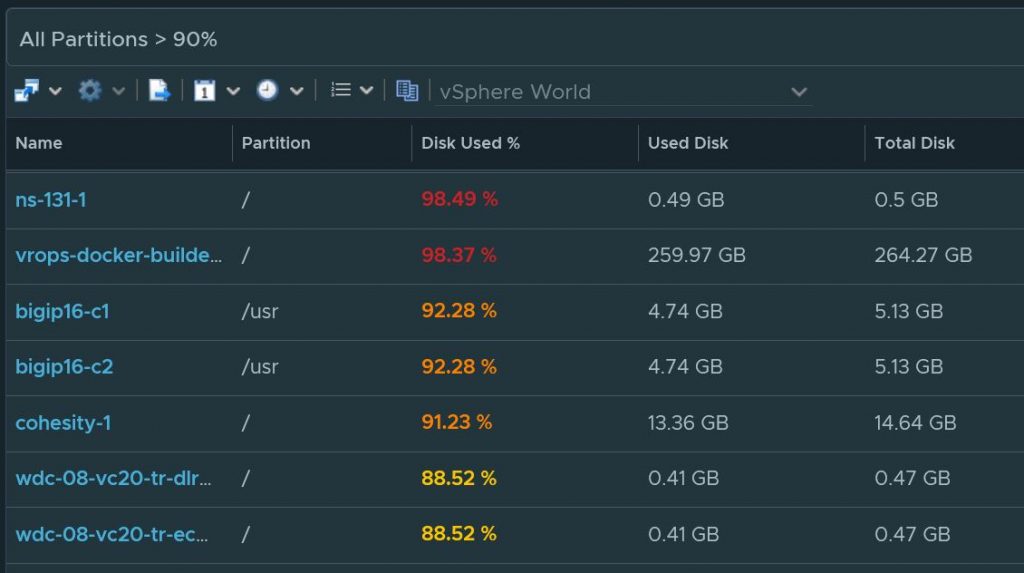
Customers have told me stories in the past where certain partitions filled up which have caused certain applications to crash.

In this super post, I will uncover all the vROPS techniques on how to do time-based filtering and monitoring. I

It is now the year 2022 and if your company is still taking hours and days to troubleshoot issues, still