In this super post, I will uncover all the vROPS techniques on how to do time-based filtering and monitoring. I will show you how to filter and monitor based on 9am-5pm performance data, average/max/min performance for a given time and how to filter it, see performance data changes by time, and even see when the last time the power settings changed on a Host, and more. Before I begin, I would like to give out a shout-out for my first two donators of VMignite: Joy and Antonio. Some exclusive dashboards were sent to them for the donation and this post is dedicated to the donators. Thank you once again. For those who would like to donate to the site please click on the donate tab in the menu. Doing so will encourage me to share out more vROPS tips and tricks.
Use Cases that will be covered
- How to monitor performance data based on time
- How to monitor performance data based on 9am-5pm time settings
- How to filter performance data based on time
- How to view when the last time the power settings changed for a Host System.
- How to view VM Creation date using a list view
- How to view performance data changes by time
How to monitor performance data based on time
In this example I will get Host CPU usage average and maximum for a given week.
Create a List view and provide a name for the view and select Host System as your subject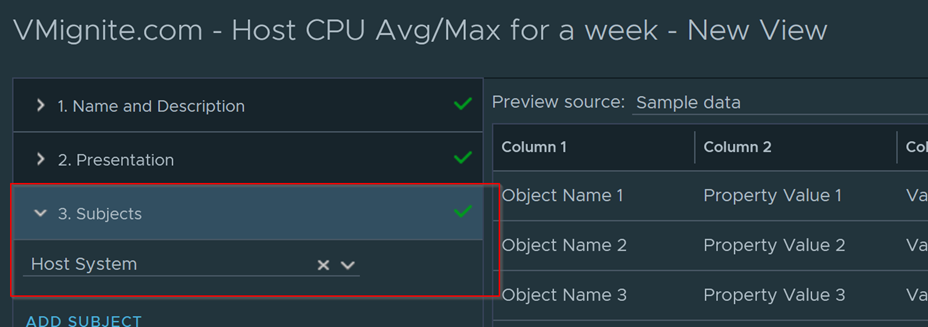
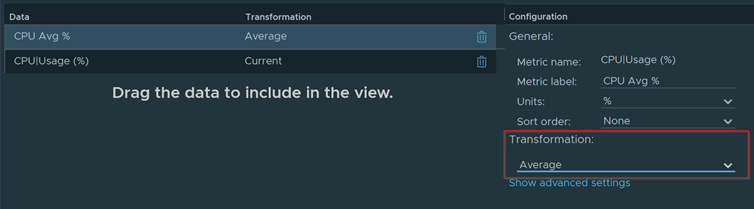
Click on Data and expand CPU and double click on Usage (%) until it appears in the Data box twice 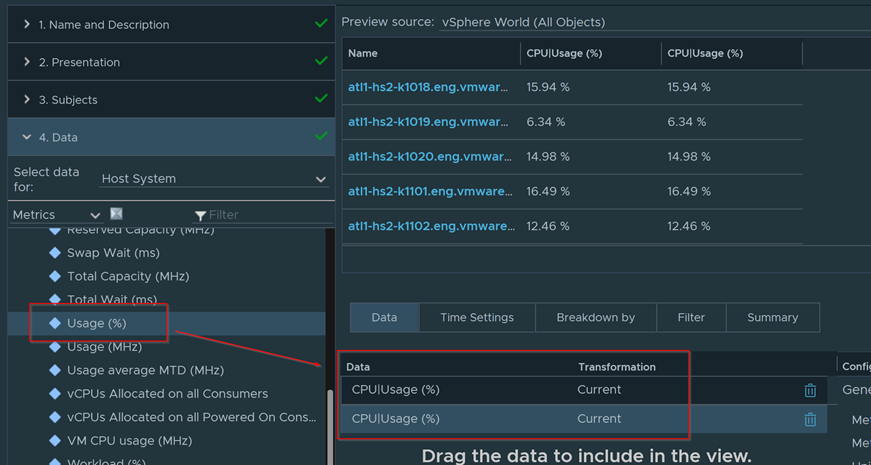
Select one of the CPU|Usage (%) metric and change the Metric label to CPU Avg % (this will change the display name of the Data) 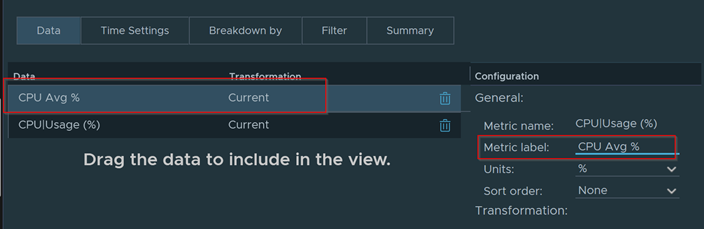
Change the transformation to Average. This changes the value from current CPU usage data to average for a given time.
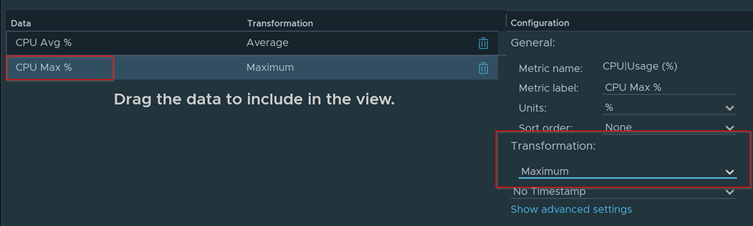
Select the other CPU|Usage (%) and repeat the above steps and change the metric label to CPU Max % and Transformation to Maximum
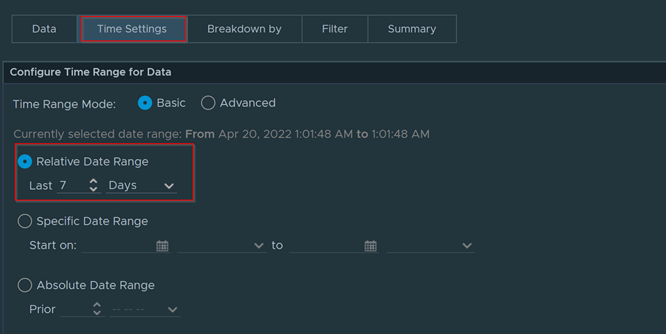
Now we need to set the time on the data. Click on Time Settings and set the desired time frame. Default settings is 7 days, but you can change it to a month, 90 days, 6-months, etc.
How to monitor performance data based on 9am-5pm time settings
In the time settings of the view, click on Advance and the click on the Business Hours check box 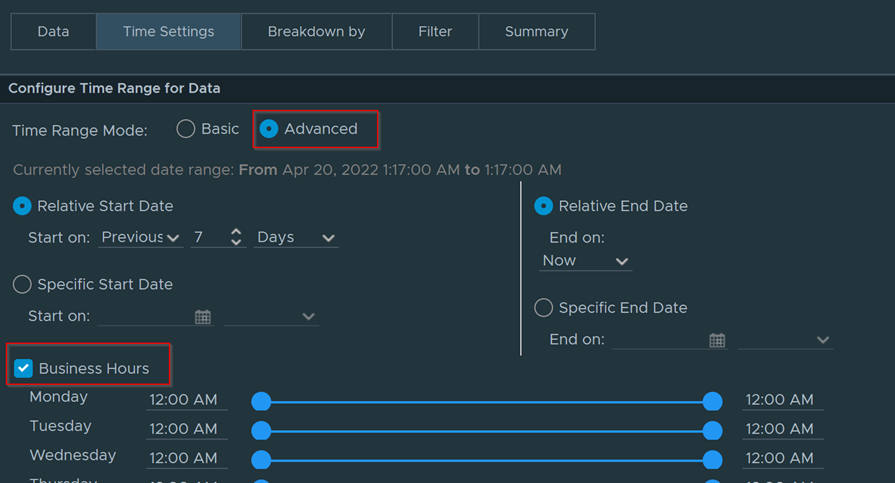
Change the time for your desired business hours. Below are example settings for Monday to Friday 9am-5pm with weekends disabled 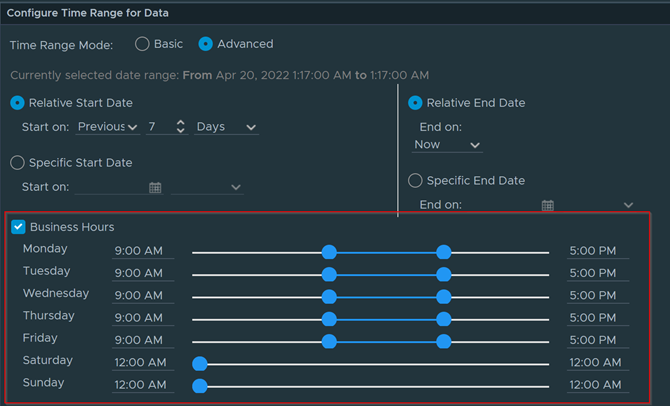
Now go back to Data and enable it for which metrics you would like this to apply to. Save your view when you are done 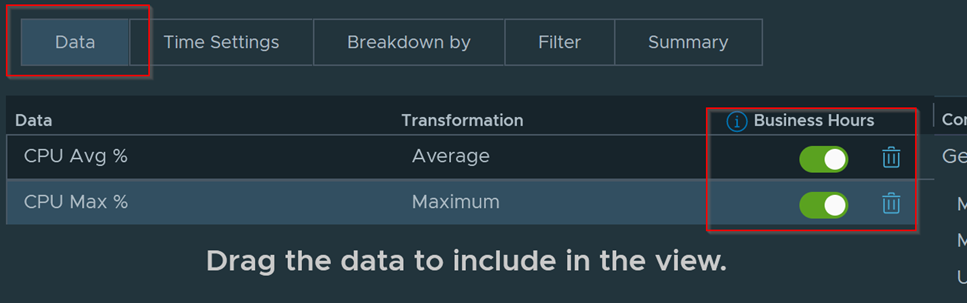
How to filter performance data based on time
Using the above example, we can then filter any view data to show only any Host CPU Avg % greater than 20% only. To do this we will click on the Filter tab, Select the metric CPU Usage % metric and change it from Current to Average instead and then entering our desired filter of is greater than 20%. Previewing the data we can now see that it only list Host with CPU Average % that are greater than 20%. 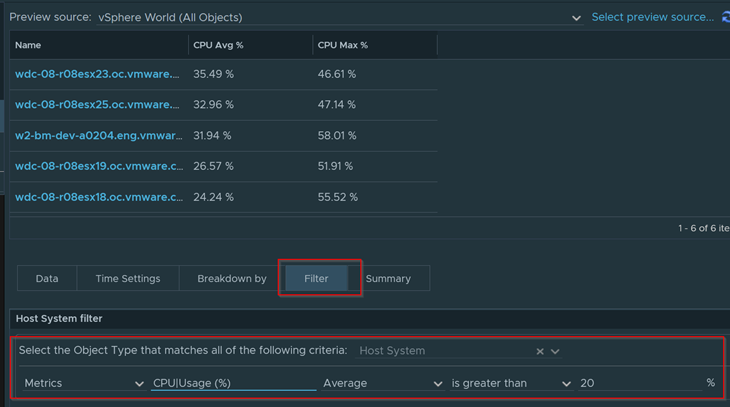
How to view when the last time the power settings changed for a Host System
In this guide we will find out the date and time when the Host power settings last changed and how long ago since it changed.
In the list view, change the dropdown to Properties and double click on Runtime > Power State metric till it shows up on the right side 3 times. 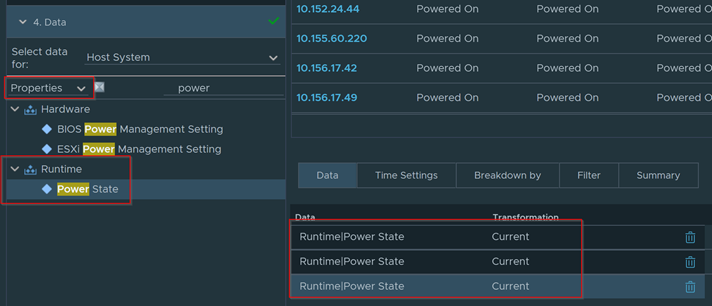
Select the 2nd Power State metric change the Transformation to Timestamp and Absolute Timestamp. This will give us a date format on when the power state last changed. 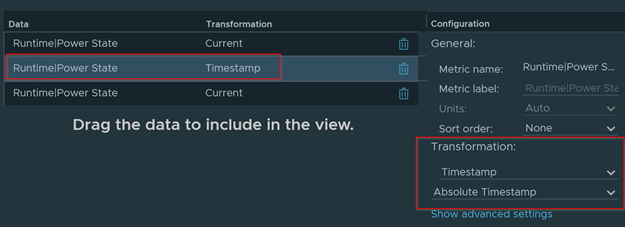
Select the 3rd Power State metric change the Transformation to Timestamp and Relative Timestamp. This will give us a time format on when it was last changed. 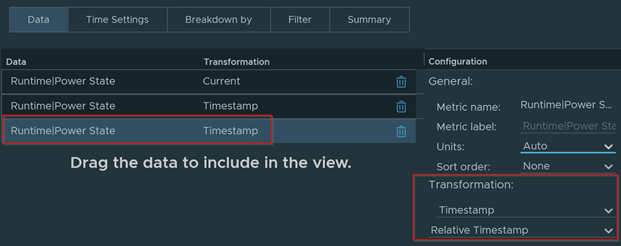
Previewing the data, we can see how this looks. Change the metric label accordingly to whatever make senses to you. Save the view once done. 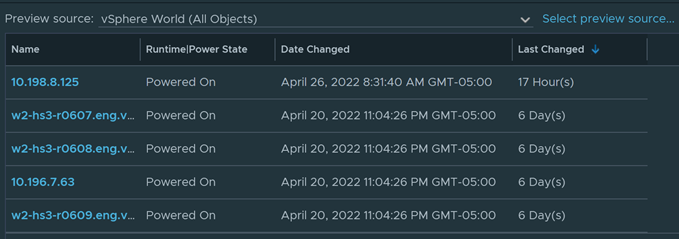
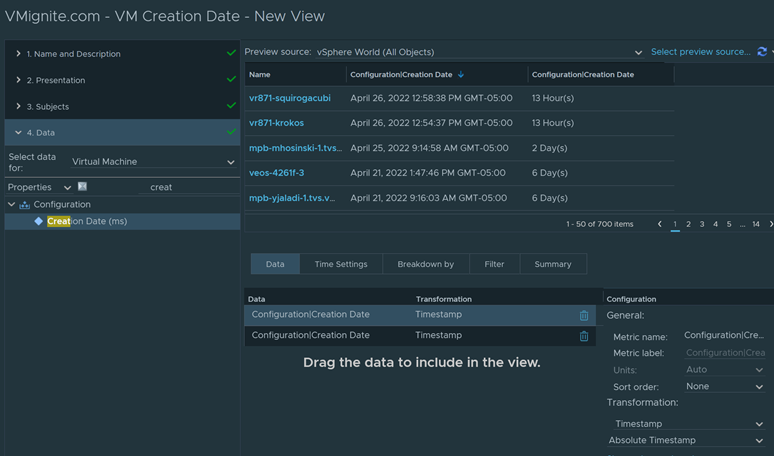
How to view VM Creation date using a list view
Create a list view with the Subject of Virtual Machine. We would add the Property > Configuration > Creation Date (ms) twice and change the Transformation to Timestamp Absolute Timestamp and the other one to Timestamp Relative Timestamp.
You can read more about how time settings works below.
How to view performance data changes by time
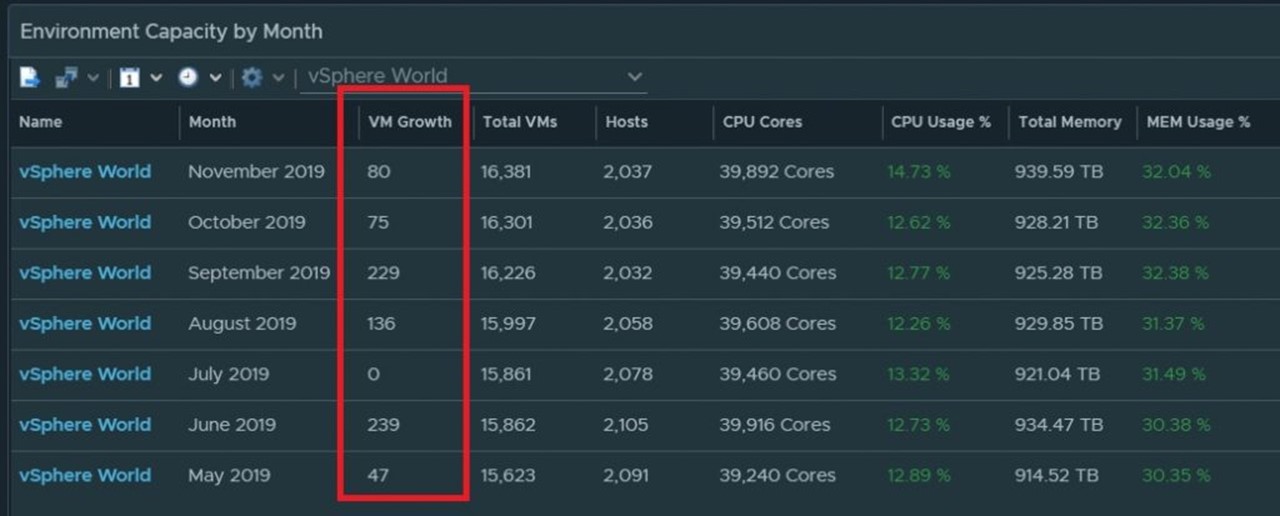
Using the trick below, we can see how VM growth changed by month for a given environment. We can also use this trick to see how CPU, Memory, and Disk used % changed in the past month for example for VMs, Host, Cluster, and vCenter for example.
http://www.vmignite.com/2019/12/vrops-7-how-to-get-vm-growth-stats-by-any-given-time/