This is for Managers who would like to know how many average VMs have we grown each month? How much have we grown in the past 6-months? In this guide I will show you how to use Expressions to formulate these calculations. This works for vROPS 7.0 and above.
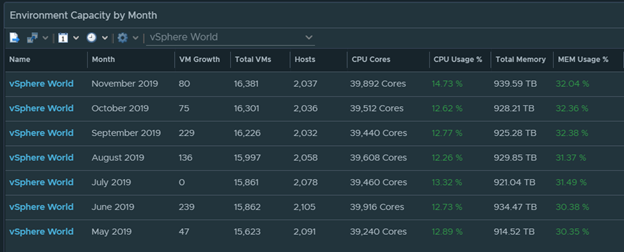
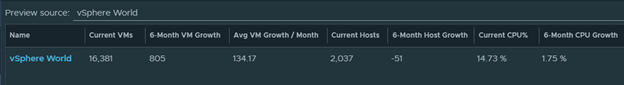
This is how it will look. As you can see here, this company has 16,381 VMs and have grown over 800 VMs in the past 6-Months. The average growth for a month in that span is 134 VMs

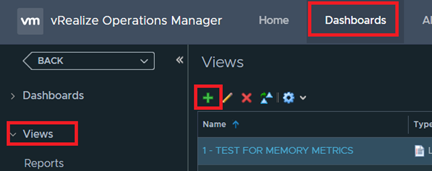
Now let’s start creating this view to be used in a report or dashboard. First let’s create a new view, go to Dashboards > Views > +
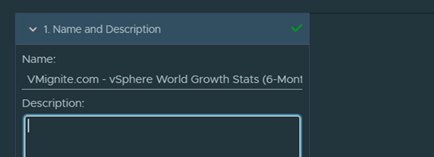
Provide a Name for our view
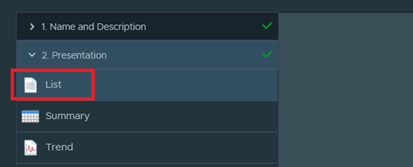
Under Presentation, select List
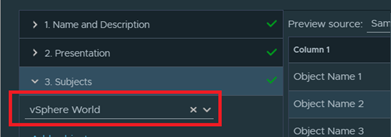
Under Subjects, choose vSphere World as this allows us to monitor the entire environment. You can also choose vCenter, Clusters, and Datacenter instead as well.
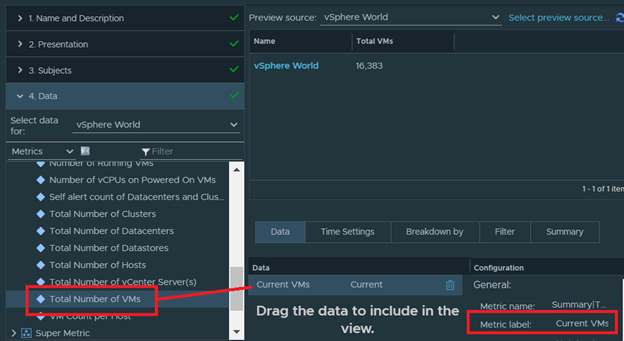
We would like to display how many total VMs there are currently. Choose the metric Summary > Total Number of VMs. Change the Metric Label to display Current VMs
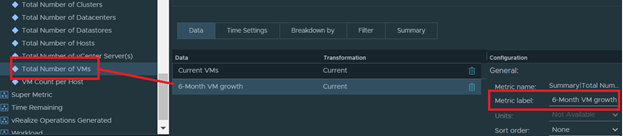
Next we would like to display how many VMs have grown in the past 6-Months. Add the metric Summary > Total Number of VMs again. This time change the Metric Label to display 6-Month VM Growth
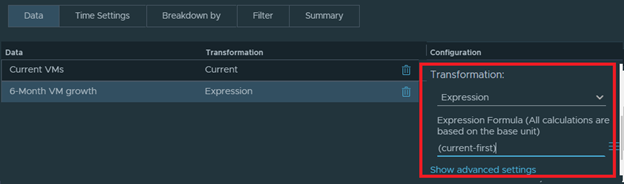
Change the Transformation to Expression and type in the following expression formula (current-first). This will take the current VMs today which is 16,381 and subtract it from the first value 6-months ago.
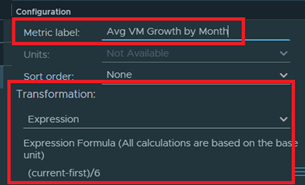
We would also like to display the average VM Growth per month. Add the same metric a third time and relabel it as Avg VM Growth by Month with an expression formula of (current-first)/6
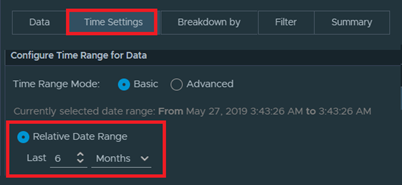
Since we want 6-months’ worth of data, we need to change the time frame to 6-Months. Go to Time Setting and change the Relative Date Range to 6-Months
Save the view and it is now ready to be added to a report or dashboard. As you can see our results show some very good data. We currently have 16,381 VMs total and have grown 805 VMs in the past 6-months. The average growth during that span is 134 VMs per month. I also added Host, CPU, and Memory growth doing the same steps above.
If I add this to my interval breakdown view, I can see the VM growth by month in greater detail. You can download this dashboard here http://www.vmignite.com/2019/01/download-vrops-environment-growth/