In this guide I will walk you though how to add extra fields to an alert. For example, if a VM has disk latency, the alert doesn’t show which datastore the VM is on. This can be quite inconvenient if the alert is sent out as an email, as this information can be very useful especially if a lot of VMs are effected on the same datastore. In this guide I will show you how to add any parent or child object to an alert. Special thanks to Uday Mantri (one of my customers) for showing me this trick. I only get credit for writing up the guide.
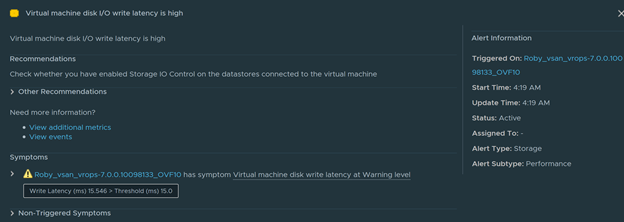
As you see in this example alert, my selected VM has write latency, but there is no information on which Datastore the VM is on
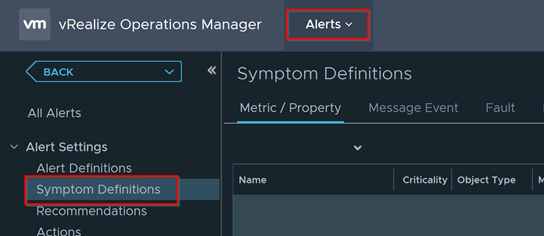
We are going to add this information by creating a new symptom. Go to Alerts > Symptom Definitions
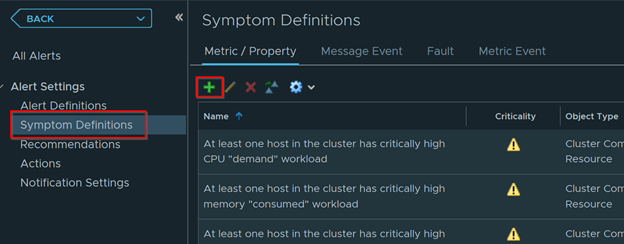
Click on the + sign to add a new Symptom
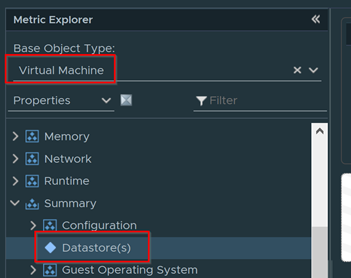
Choose Virtual Machine as the object type and then select Properties > Datastores as the metric
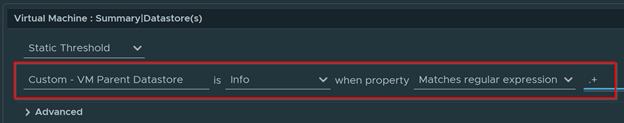
Configure the following
- Provide a name for the symptom
- Select the critical level
- Select Matches regular expression
- And then enter .+ in the filter box
- Click on Save
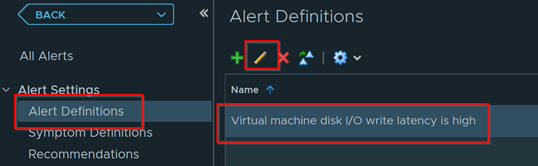
Now we need to add the symptom to the alert we want to add the extra field. Go to Alert Definitions > Edit
Search for the custom Symptom we created earlier and drag it as a separate symptom. Make sure to choose All in the top drop down as we want all to apply. Click on Save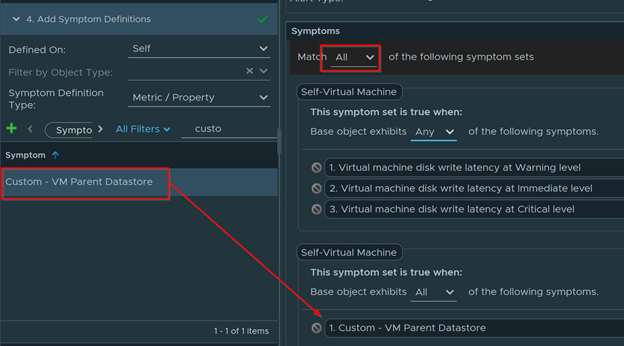
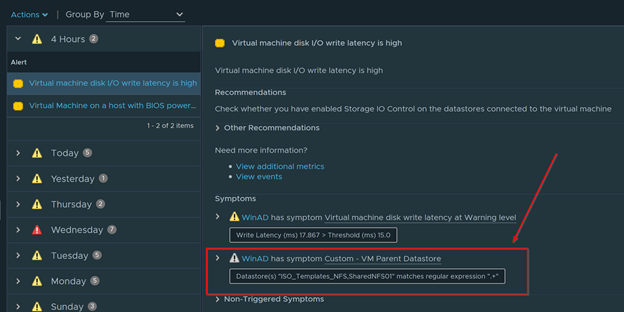
Wait about 10 minutes and you should now see the name of the parent datastore in the alert details. You can also do this for performance metrics and other properties as well.