The highest level of monitoring in my opinion is automation. That is when you are leveraging monitoring tools to automate your everyday troubleshooting, capacity, alerting, and monitoring needs. In theory most people think automation is hands off self-healing. As in it will just fix itself without any user interaction. To be more realistic, mostly all use cases of monitoring need the final input of the stakeholder to decide what are the next best steps. Therefore, in most cases, automation when it comes to monitoring is automating the process as much as possible to get you the results as quickly as possible so that the stakeholders can decide what are the best next steps to take. In this guide I will walk you through on how to automate almost any typical engineering and operation task using vROPS alone. Remember Automation is a timely process to perfect and repeated testing is key. In the end it will be worth it once successful.
What are the best use cases to Automate?
- Troubleshoot any application or VM in minutes!
- Do a complete Health Check or your environment with one click on the button
- Manage Capacity in minutes (Growth, inventory, optimization)
- Monitor your entire Infrastructure in one pane of glass (vCenter, VMs, Host, Datastores, vSAN, NSX-T, VDI, vIDM, vRNI, Log Insight, vROPS, vRA, etc)
Unrealistic as it sounds, customer that have done PSO engagements with me have already seen that I have proven this can be done with just using vROPS alone. Feel free to reach out to your TAM to setup a free demo with me to see for yourself.
Ways you can automate using vROPS
1. Using Automation Central (Easy)
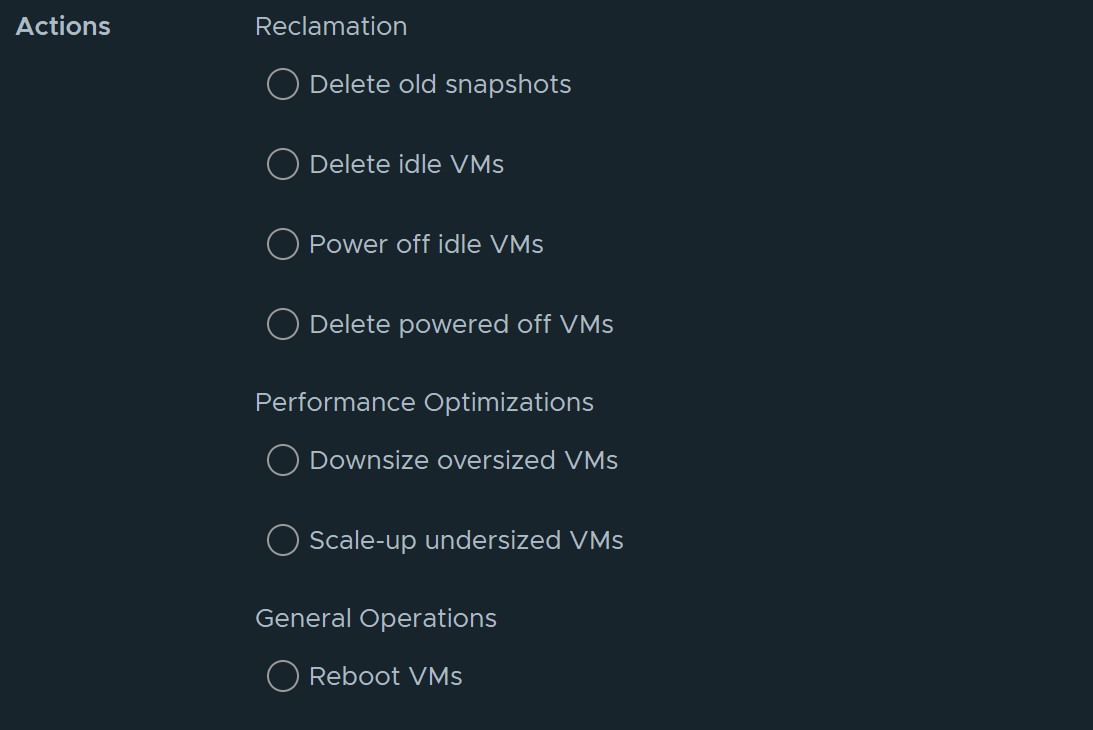
Using the Automation Central feature in vROPS allows you to automate task such as rebooting VMs, reclaiming resources, and rightsizing VMs in a recurring schedule you choose. Read the guide below on how to use this feature
http://www.vmignite.com/2021/05/vrops-8-4-how-to-use-automation-central-to-schedule-task/
2. Create an alert and attach an Action to it (Intermediate)
This will answer the question when this problem happens, I want it to automatically fix itself by doing this. There are infinite use cases you can self-automate using this technique. This is a three-step process, however although I show my customers how easy it is to automate anything using this feature, none of my customers end up doing it. Why? Because real Engineers rather know the problem happened and get alerted on it and fix the root cause so it doesn’t happen again rather than mask the problem. For example, if vCenter keeps crashing, rather than automate it to automatically reboot each and every time, why not figure out what is causing the crash so it doesn’t happen ever again.
- Step 1: You need to create the alert based on criteria you define. See example guide below http://www.vmignite.com/2021/10/vrops-8-6-how-to-create-alert-definitions-using-conditions/
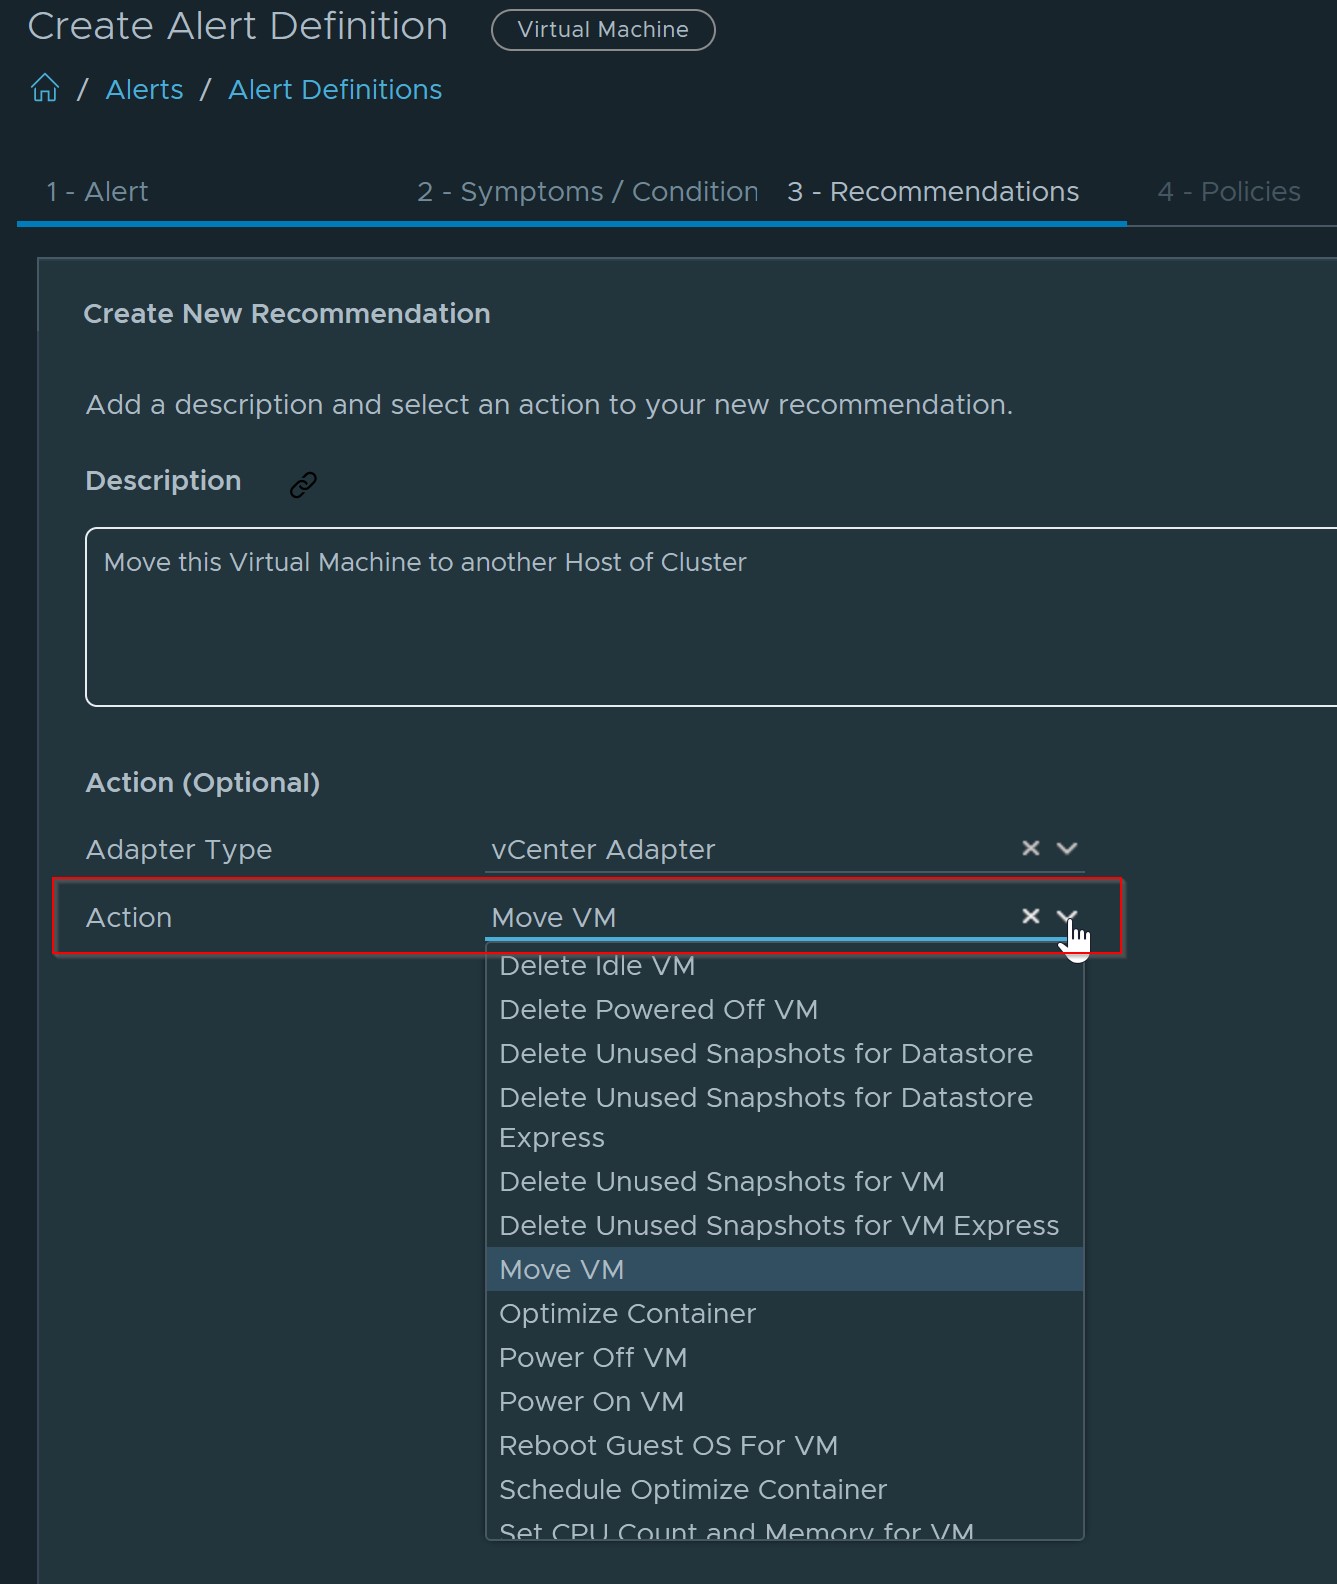
- Step 2: You will then need to attach a Recommendation with an Action to it. You can choose from the many predefined Actions available or import more using the vRO management pack which will provide you with endless automated Actions
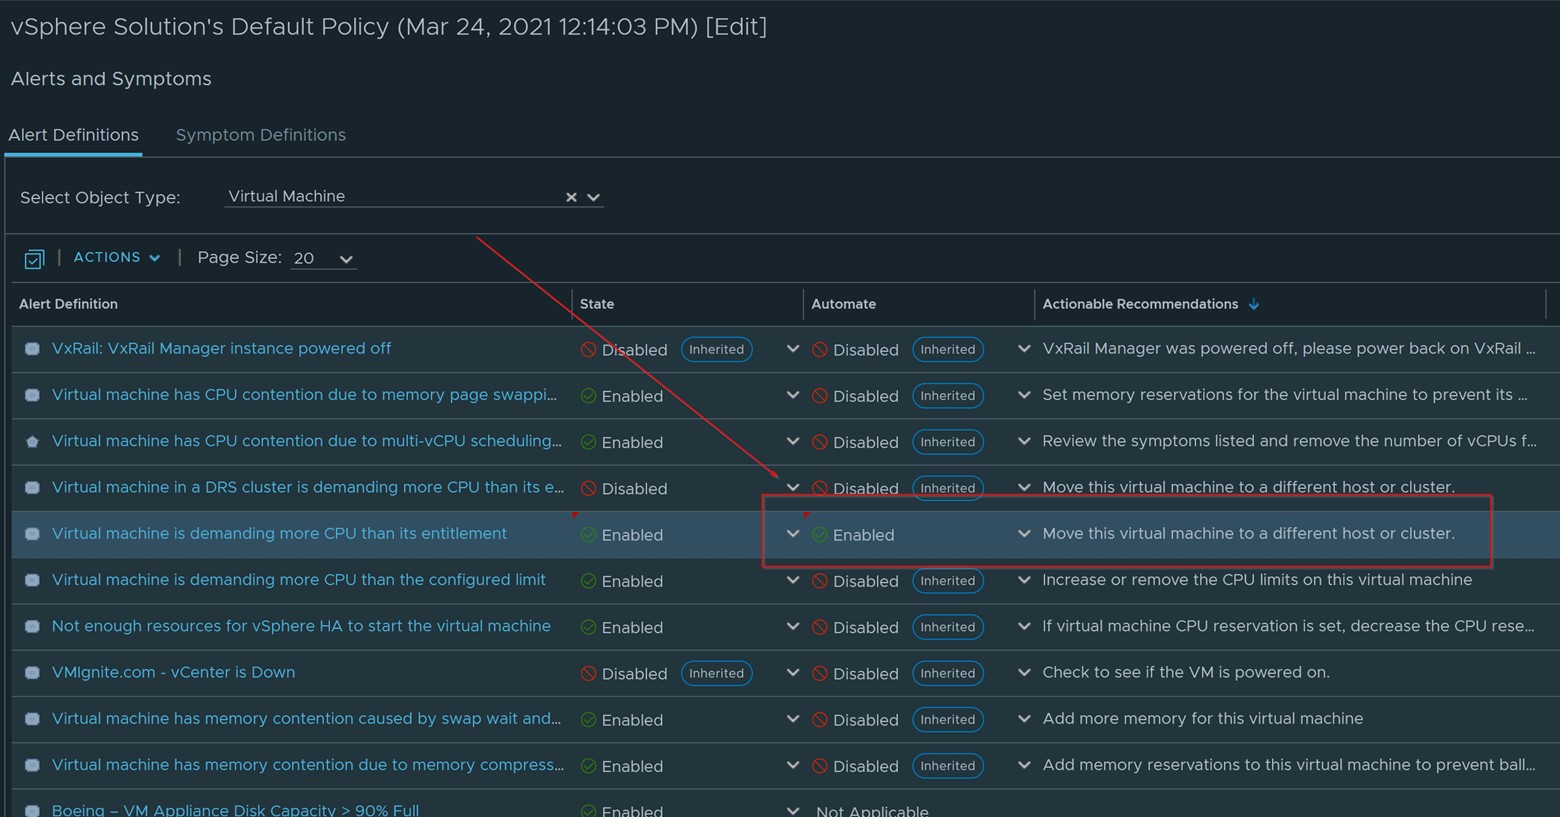
- Step 3: Next you will need to edit your default policy and enable the automation of this Action to take place each time the alert happens. See below screenshot of how to Enable the Automation of the Action
3. Know something is healthy or unhealthy using custom properties (Easy)
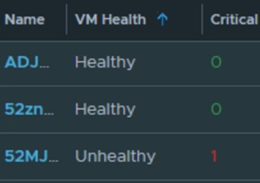
Rather than check numerous metrics for a VM for example, management wants just one simple metric for Host, VMs, vCenter, and Datastores on whether it is healthy or unhealthy based on criteria that you can define and control. This can be done using the guide I already written below. This automates as many checks as you want and rolls it up to one simple Good or Bad result. You can also use the same technique for tagging purposes and more.
http://www.vmignite.com/2019/04/vrops-7-5-using-custom-groups-to-create-a-custom-health-metric/
4. Using Super Metrics to create Infinite Metrics (Expert)
If you believe vROPS doesn’t have the metrics you want or the metrics out of the box is not precise enough for you, you can just create a whole new one using a mix of formulas, if-then-else scenarios, and mixture of different metrics and properties comparison to create a brand-new custom metric or property. For example, you can create a super metric to show you how many Windows 2012 servers you have in a vCenter, how many Host are down in a vCenter, etc. Below are some examples super metrics that I created for customers
- Custom VM uptime metric based on OS uptime https://developer.vmware.com/samples/7421/vmignite.com-vm_uptime.json?h=Sample
- Custom Cluster capacity available % metric
- Host that has mismatch Datastores http://www.vmignite.com/2019/04/vrops-how-to-find-out-which-clusters-have-inconsistent-datastores-mounted-to-the-host/
You can download more Super Metrics here: https://developer.vmware.com/samples?categories=Sample&keywords=&tags=vRealize%20Ops%20Super%20Metrics&groups=&filters=&sort=dateDesc&page=
5. Creating a Dashboard to solve a Use case (Intermediate)
Yes, dashboard is automation if created with purpose. Don’t believe me? Check out the dashboards below that I shared out to solve the scenarios I mentioned earlier. Anyone can create a dashboard, but it takes a lot of time and testing to create one that will solve an entire use case. See the below examples to see what I mean. One of my dashboards could take weeks and months to perfect.
- Do a complete Health Check or your environment with one click on the button http://www.vmignite.com/2021/02/vrops-vsphere-health-checker-dashboard-2-0/
- Get an entire 360 degree of entire Environment inventory (latest VMs, capacity, OS comparison, performance data, count of everything (folders, switches, datastores, etc). http://www.vmignite.com/2020/12/download-vrops-complete-360-inventory-dashboard/
- Get a one pane of glass view of capacity and infrastructure http://www.vmignite.com/2021/06/vrops-8-4-executive-dashboard-download/
- Get inventory and performance data for entire VMware vCF stack (NSX-T, vRA, vROPS, vRLI, vRNI, vIDM, etc) http://www.vmignite.com/2021/05/vrops-vmware-appliance-monitoring-dashboard/