With the release of vROPS 8.6, creating alert definitions is easier than ever before. With the new addition of being able to configure “Conditions” into the Alert itself, there is not much of a need to create Symptom definitions anymore. One thing to note is that you can still combine conditions and symptoms into the same alert definition. In this guide I will create a sample alert definition using this new feature.
In this guide I will create a new alert for any VM that is having degraded performance issues for CPU, Memory, and Disk. If you want to learn more about my recommendations for alerting read my alerts dos and don’t post
Go to Configure > Alerts and click on Alert Definitions to view all the alerts
Click on Add to create a new Alert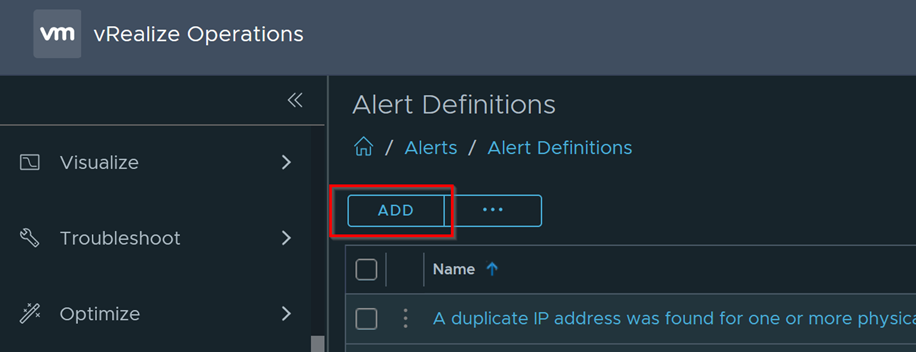
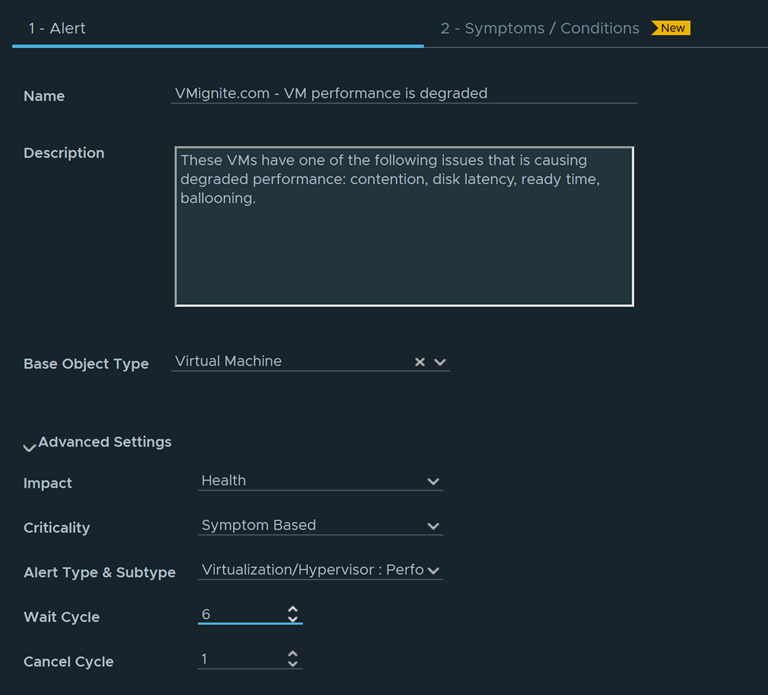
Configure the alert and click on Next when done
- Name: Provide a name for the alert
- Description: Optionally provide a description
- Base Object Type: Choose your base Object in this case I am looking to create alerts based on virtual machines, therefore I have chosen Virtual machine as my base object
- Criticality: For Criticality you can choose Critical, immediate, warning, etc. I chose Symptom Based which will take the highest value of the child symptoms and conditions.
- Alert Type and Subtype: make sure to put in a category that makes sense to the alert itself. This will make it easier to filter alerts later for notifications and for dashboard purposes.
- Wait Cycle: one wait cycle is 5 minutes, which in my opinion is not enough time to catch realistic scenarios. For example, a VM can spike up occasionally for disk, cpu, or memory utilization so that is OK if it happens for less than 5 minutes. However, if it continues to spike for over 30 minutes than alert me. Hence why I changed the Wait cycle to 6 which would equal out to 30 minutes. (6 x 5 minutes = 30 minutes)
- Cancel Cycle: I left this at default of 1 as if any of the conditions are resolved, cancel the alert immediately.
Make sure Conditions is selected and add in the metrics you want to apply a condition for. Just take the metric and drag it to the left as shown below. In this example I took 5 metrics that will trigger my alert and I set the thresholds and critically for each accordingly. Make sure to place them all in the same box as shown.
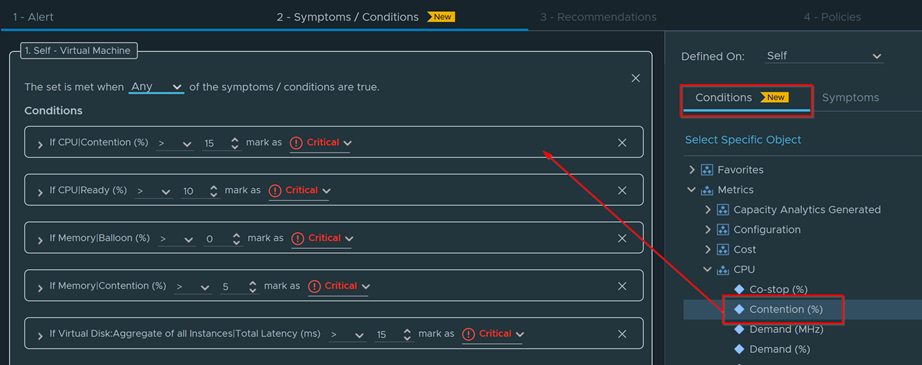
Because all the conditions are in the same box, I can set the filter for these conditions in that same box. If I choose All, then all 5 custom conditions have to be met (which most likely will never happen) for this alert to trigger. This is not what I want, as I want if any of the 5 conditions occur, trigger the alert. Therefore, I will change the filter to Any

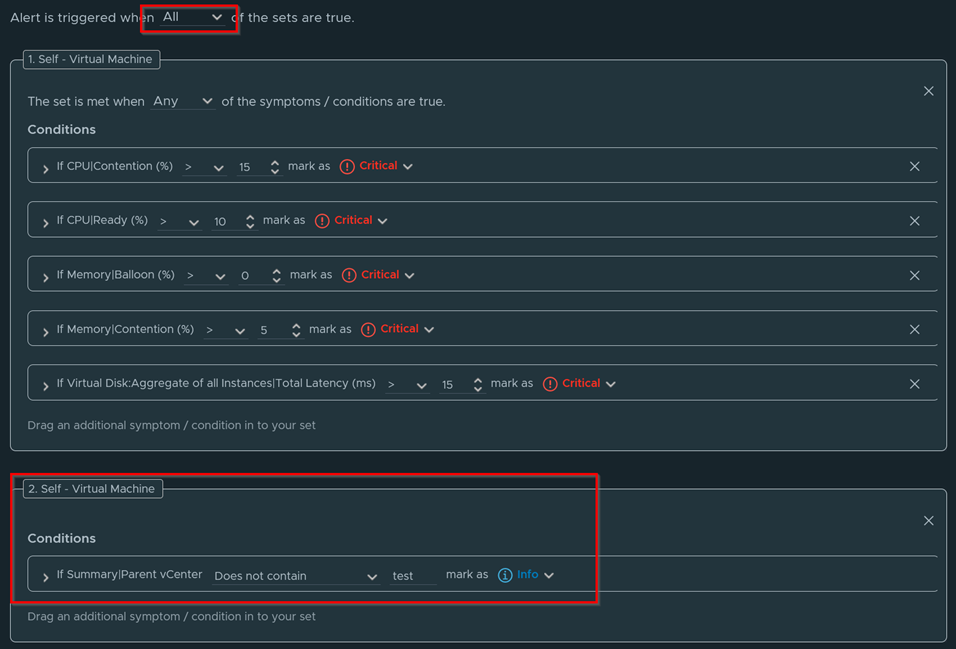
Now let’s say you don’t want this alert to alert on certain vCenters, VMs, clusters, etc. In this example, I don’t want this to apply to any vCenter that has the word “test” in it. I will add the property Parent vCenter into a second box and fill in the conditions to remove any vCenter that has the words “Test” in it. Very important, I will change the filter for both boxes to All on the top, meaning each box must occur for the alert to trigger.
So, let me explain, since the first box has 5 conditions and it is set to Any, only one of the 5 conditions in the first box must occur for that box to be active. While the second box has only one condition, but it must trigger no matter what since I set the top condition to All. If I change the top to Any, only one of the boxes is needed for the alert to trigger.
Click on Next and it will bring us to Recommendations where you can create or add one or many recommendations as needed. 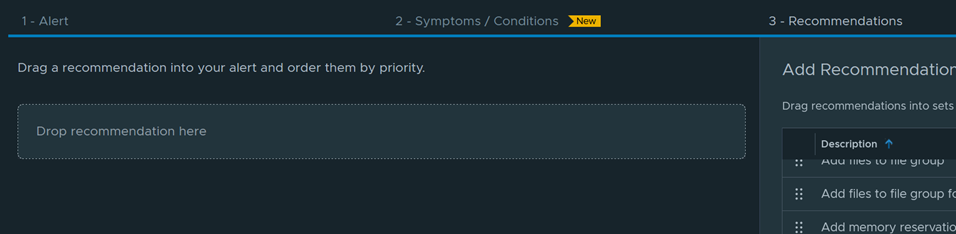
Click on Next and it will bring us to the Policies page. Make sure to check all policies shown here for it to activate the alert.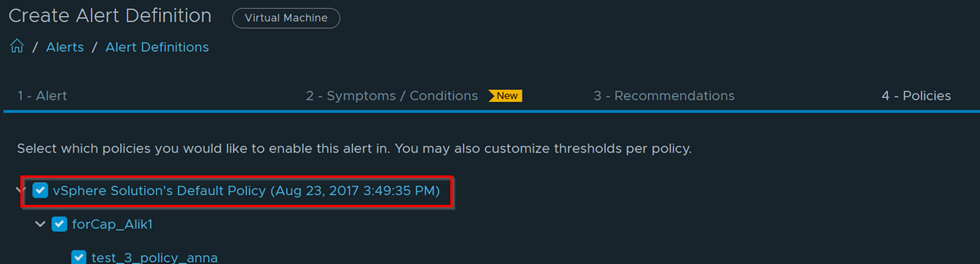
Click on Next and optionally choose a notification method if you want it emailed out or forwarded to a 3rd party system such as a ticketing system for example. Save the alert for it to apply. 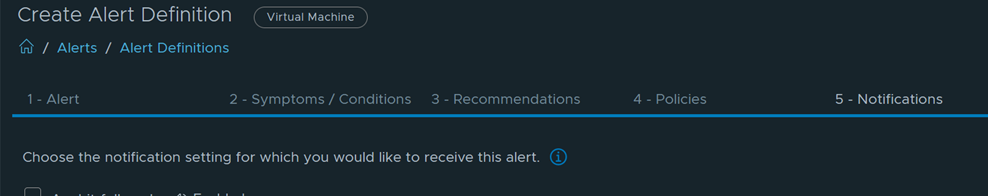
Wait about 45 minutes since we put 30-minute wait time and go to Troubleshoot > Alerts to see if any alerts got triggered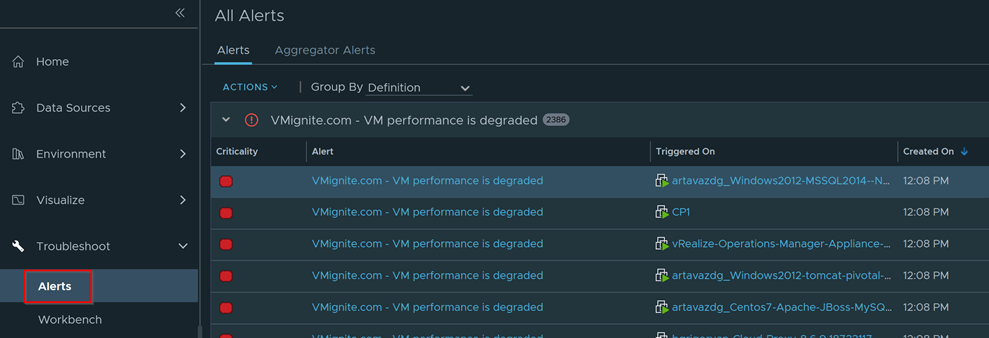
If you click on each alert it will show you what triggered the alert. As you can see in the below example our VM has high disk latency and it is on a vCenter that doesn’t have the words test in it. 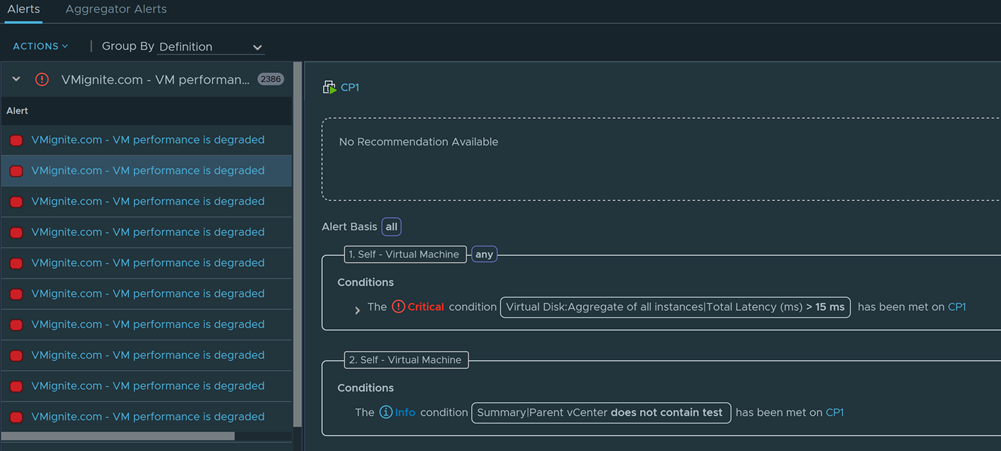
If you click on the dropdown you can view the details and history of that metric 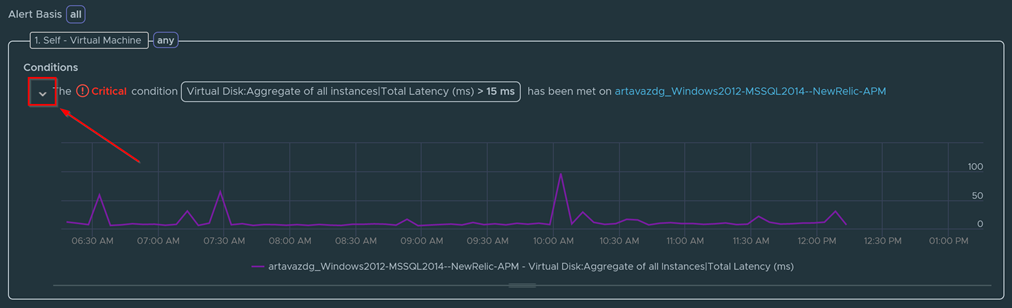
Pingback: vExpert Cloud Management October 2021 Blog Digest - Möbius Business Technologies Ltd.