Monitor the performance and configuration of the following appliances: vCenter Servers, NSX, NSX-T, vRA, vROPS, Log Insight, Orchestrator, Life Cycle Manager, Network Insight (vRNI), Vmware SRM, vIDM, Air Watch, and Cloud Proxy appliances. Quickly compare performance stats such as CPU, Memory, Contention, Disk performance, and more. You can also compare configuration stats such as CPU, Memory, IP addresses, VM Tool versions, VM version, and more.
Download here: https://code.vmware.com/samples?id=7599
Monitors the following products
- vCenter Server Appliance
- NSX, NSX-T
- vRA
- vROPS
- Log Insight
- Orchestrator
- Life Cycle Manager
- Network Insight (vRNI)
- Vmware SRM
- vIDM
- Air Watch
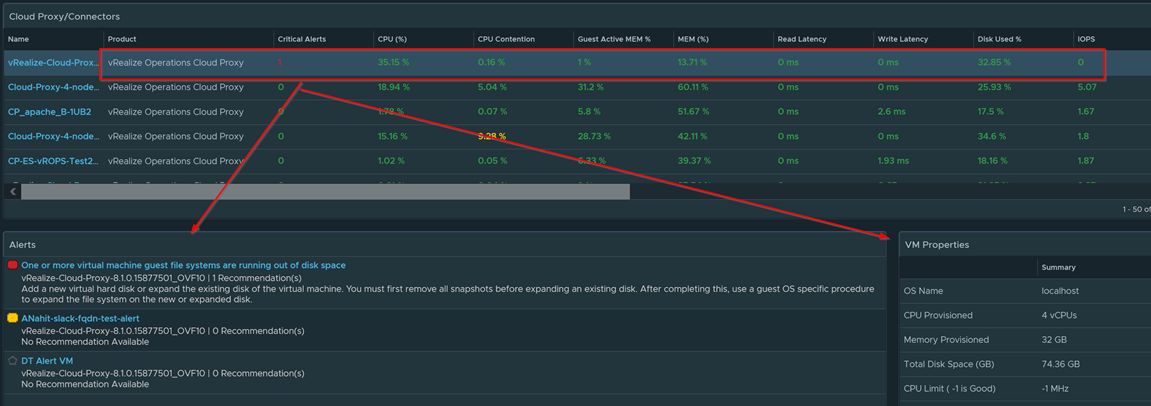
- Cloud Proxy appliances
User Guide
Compare product to each other based on performance metrics (CPU, Memory, Disk Latency, IOPS, Contention, etc)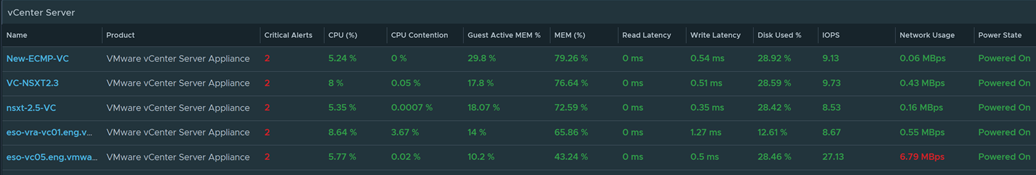
Scroll over to the right to get configuration metrics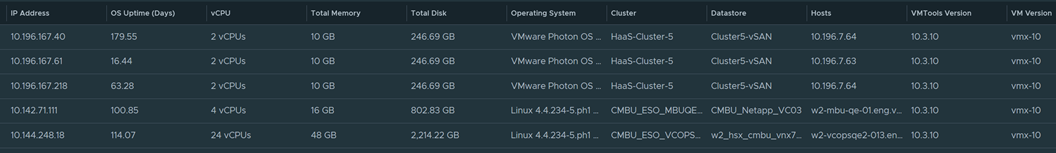
Highlight any VM and scroll to the bottom to view alerts and properties of the VM
Instructions on how to Import Dashboard
To import in version 7.0 and above
-
First unzip the file you just downloaded, it will contain a dashboard and a view file
-
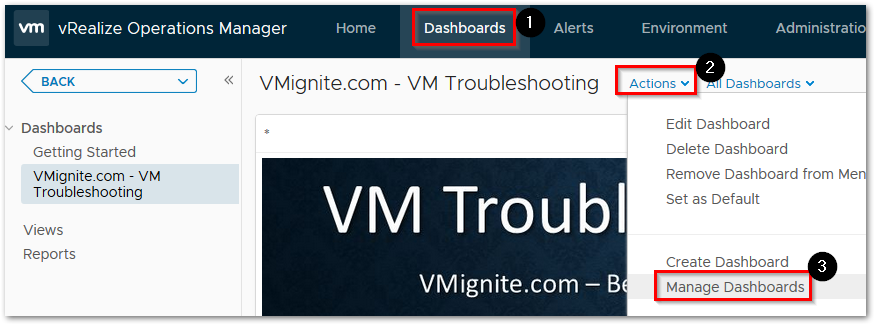
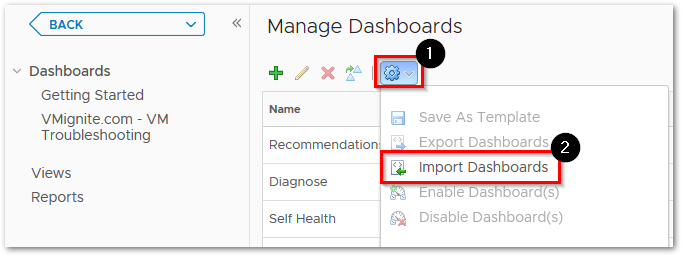
Go to Dashboards > Actions > Manage Dashboards
-
Hit the dropdown and select Import Dashboards. Import the Dashboard.zip file
-
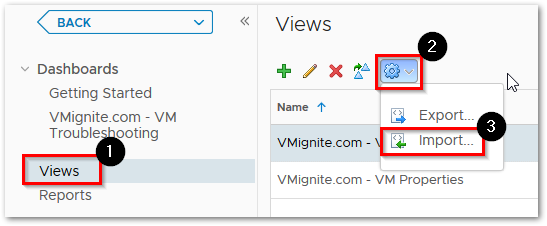
Next to go Views > Dropdown > Import. Import the View.zip file
- If you get any errors during the process, make sure to click overwrite before importing
Pingback: vExpert Cloud Management May 2021 Blog Digest - Möbius Business Technologies Ltd.
Love this dashboard and I’ve found it very helpful. For some reason this is only finding 3 of my 4 vCenter appliances, any ideas why it might not be picking one of them up?
The vCenter has to be an appliance and also has to be managed by one of the vCenters that you registered to vROPS. Search for your name of vCenter in vROPS. Go to metrics and select properties > Summary|Configuration|Product Name. See if this shows up as vCenter Server. Thanks for the feedback
It is not showing the vcenter appliances
Shows Vrli vrni nsx
The vCenter has to be an appliance and also has to be managed by one of the vCenters that you registered to vROPS. Search for your name of vCenter in vROPS. Go to metrics and select properties > Summary|Configuration|Product Name. See if this shows up as vCenter Server. Thanks for the feedback