In this guide I will show you how to create your own custom health metric based on criteria that you can control. One of my customers once gave me a half a point off from a perfect dashboard because they wanted a metric to tell them if their Virtual Machine is healthy or not. With vROPs 7.5, we can finally create this custom property. I will walk you through creating a custom group that checks for capacity, CPU, Memory, and disk performance issues on a VM. It will report back “Healthy” if everything is good while if any of the bad criteria applies it will report back “Unhealthy“. This is possible using Super Metrics as well, but creating this super metric is very time consuming and cannot be easily edited for those who don’t know how to do Super Metrics.
In this example: This is what I chosen to define an Unhealthy Virtual Machine
- CPU Demand % is greater than 85%
- Memory Usage % is greater than 85%
- Disk Read Latency is greater than 15ms
- Disk Write Latency is greater than 15ms
- C: Drive less than 3GB of disk space
- Root Drive less than 2GB of disk space
You can also add more criteria if you like. See my health check dashboard for more ideas for VMs, Clusters, Host, and Datastores problems: https://code.vmware.com/samples?id=5639#
Step 1: Create a custom group for Unhealthy VMs
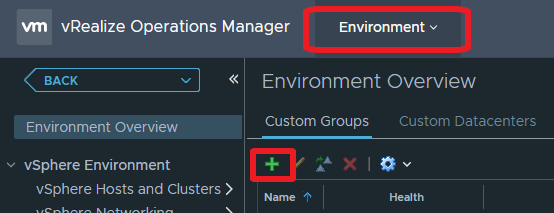
First we need to create a new Custom Groups. Click on the Environment > 
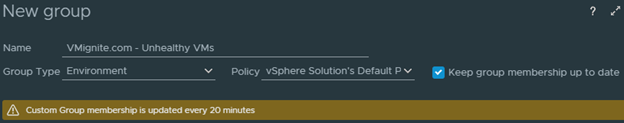
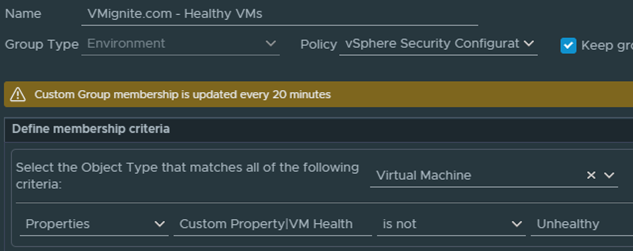
Provide a Name, Group Type, and choose your default policy. Make sure Keep group membership up to date is checked as well.
Noticed how it says this group will be updated every 20 minutes. I would admit I wasn’t too happy about it in the beginning as I wanted 5 minutes. However after thinking this through, this will work as this will avoid short spikes that happens for a minute and goes away.
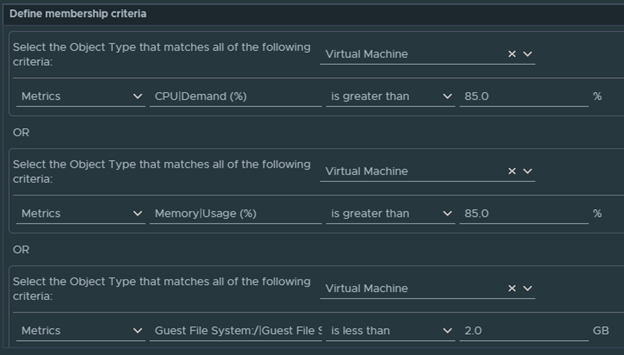
Select Virtual Machine as your Object Type and filter the following as below. Make sure to click on Add another criteria set as this will add an Or
Statement rather and And Statement
Note: if you don’t see the Guest File System Free metric, you must enable it in your policy. This is not enabled by default
- CPU|Demand(%) is greater than 85
- Memory|Usage(%) is greater than 85
- Guest File System:/|Guest File System Free (GB) is less than 2GB
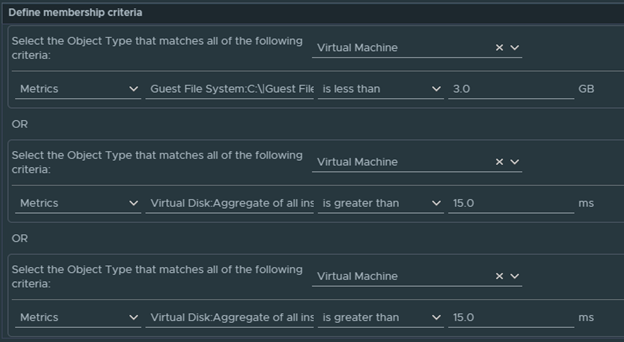
- Guest File System:C:\|Guest File System Free (GB) is less than 3GB
- Virtual Disk:Aggregate of all instances|Read Latency (ms) is greater than 15ms
- Virtual Disk:Aggregate of all instances|Write Latency (ms) is greater than 15ms
Expand Assign Custom Properties, this is where we will create a new Custom Property. In this example, if any of the following applies I wan’t it to display Unhealthy. When the same Virtual Machine is back to normal, I want it to flip back to say Healthy.
Enter a Property Name and configure the Values to what you would like it to display
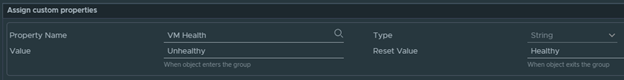
Accept the Agreement and click on OK. The Property Name and Type cannot be changed as in this metric will always exist once you create it, and whether it is a String of Numeric value cannot be changed later on either
Step 2: Create a custom group for Healthy VMs
Why? Although we created a custom group that creates a custom property that outputs Unhealthy if it meets the criteria and Healthy when it exits the group, we still have one issue. Since all of the other Virtual Machines are not considered Unhealthy, it will never be in the group that applies the tag. Therefore it will never receive a value for this VM Health property that we created and by default it will just be blank. Therefore we will need another custom group that will give Healthy VMs a value of Healthy.
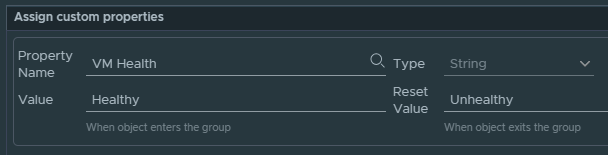
To do so, rather than reversing all the filters such as CPU, Disk Latency, Capacity, and Memory. All we need to do is reverse the new Custom Property we just created. Basically saying find me all VMs that are not tagged as Unhealthy and give it a tag of Healthy.
Create a new custom group and give it the following attributes
Custom Property|VM Health is not Unhealthy
Reverse the values as well for the same Property we created earlier and click on OK
Step 3 – Add it to a view or report
Here I added the property to my Inventory dashboard that can be downloaded here: https://code.vmware.com/samples/5629/vmware-inventory-dashboard
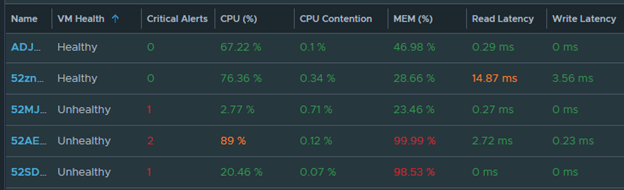
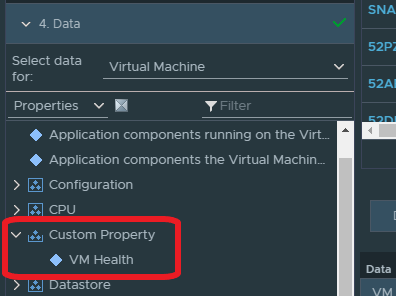
Make sure to look for it in Properties > Custom Property > VM Health
You can also create this for Host, Clusters, Datastores, and more. For a list of ideas, check out vCenter Health Check Dashboard for metrics and properties I look for.
https://code.vmware.com/samples?id=5639