First thank you everyone for making this the number 1 most downloaded dashboard on Vmware code. Also, a big thanks to the Vmware TAM community for all the positive feedback they have been telling me on how my website has helped their customers. The feedback will drive me to write even more useful content. With that being said, what better way to start than to share out my latest 2.0 version of the vSphere Health Check dashboard which has many major enhancements and has a greater amount of details than before. In this post I also wrote a full guide on how to resolve some of the main issues.
Download on VMware Code Exchange Here https://code.vmware.com/samples?id=5639#
Purpose:
Does a full health check of problems found in the environment (VMs, Host, Clusters, Datastores, vCenter). This dashboard will help prevent issues before they happen (being proactive) by identifying everything wrong with your environment today so you can fix it before it causes a problem in the future.
What it monitors:
Monitor’s capacity issues, configuration issues, and performance bottlenecks (CPU, Memory, Contention, Disk Latency)
User Guide
Select any vCenter Servers, Datacenter, Clusters, or entire environment (vSphere World) to do a complete health check on it
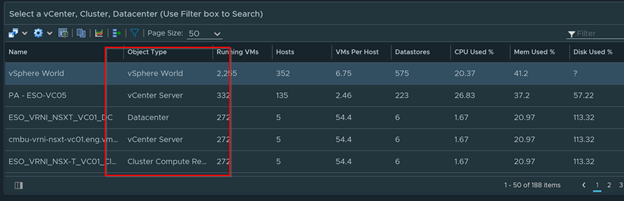
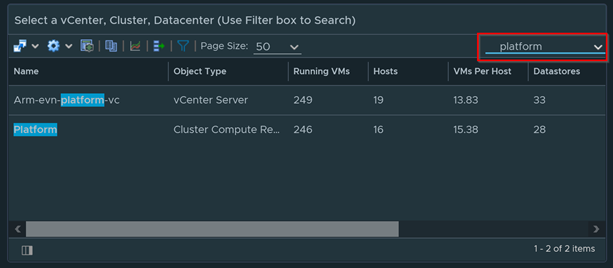
You can also use the search box to search what you are looking for
Any of these widgets can be easily exported to excel. They are also report ready, meaning you can add any of the filters I’ve created to a custom report.
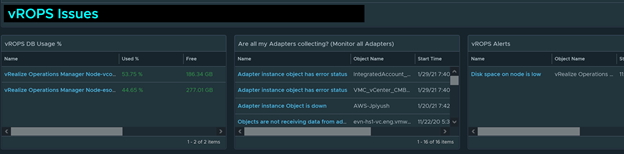
Monitoring vROPS
Monitor the health of all vROPS nodes. Make sure the vROPs DB Usage % doesn’t reach over 90%. You will need to add more disk to vROPS if this gets high. It will also monitor any adapters that are down and any vROPS alerts.
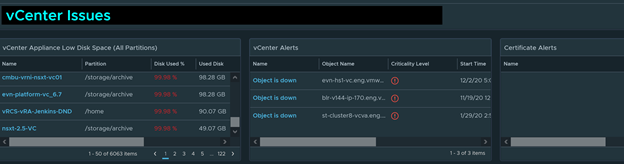
Monitoring vCenter
This monitors vCenter for any disk space issues and vCenter alerts.
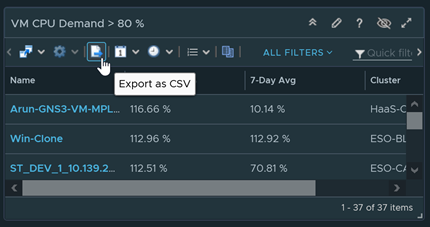
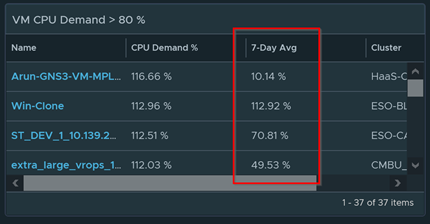
Monitoring Virtual Machines
When monitoring high CPU and high memory usage. It is important to see the 7-day average as well. If the average is high, then the VM pretty much needs more resources immediately.
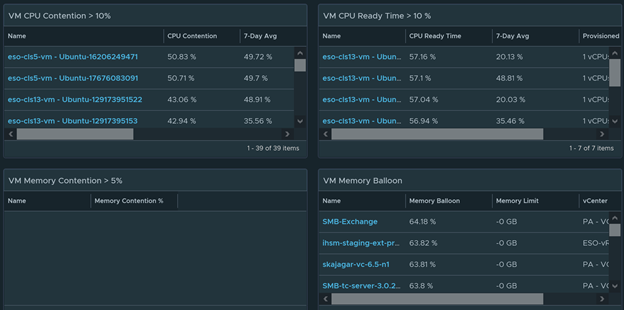
If any VM has high contention, CPU ready time, CPU Co-stop, or memory ballooning. It basically means something is constraining the VM from getting the resources it needs. There is no one simple way to fix this. These are the checks I would perform to troubleshoot the issue.
- Check to see if there are any memory or cpu limits on the VM
- Check to see if the VM has an alert that states that the Host Power settings is causing contention. ESXi Host that are not set to high performance in the power settings usually causes contention
- Check if the VM is on a highly utilized ESXi Host
- Check if the VM is on a resource pool that has resource limits assigned
- Check to see if the VM has enough CPU and/or memory resources. Notice how this is the last step. This should be your last resort
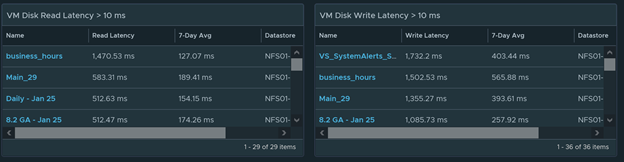
If the VM Disk latency is high, this means your disk performance is suffering. Check to see if the datastore that the VM is on has high latency as well. If the datastore is overworked, it will cause latency on other VMs that are hosted by it as well. Another good way to find out if it’s the VM or the datastore that is causing the latency is by doing a storage vMotion to an isolated datastore. If the latency drops down dramatically you will know it was the datastore that caused it
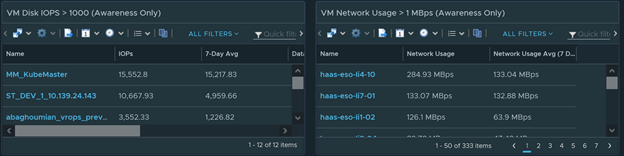
For VM Disk IOPS and Network Usage notice how this widget says awareness only. High Disk IOPs doesn’t mean there is a disk performance issue. It just means that the VM has lots of disk activity. A typical VM usually doesn’t have more than 1000 IOPS. A busy VM such as heavy Database servers, File Servers, Exchange Server, etc will have IOPS in the range of 1000-8000 depending how busy it is. If any VMs that has high IOPS or high network usage that looks off to you should be investigated. Anything over 10,000 IOPS is extremely rare and should be investigated immediately. None of the Fortune 500 companies that I know of has a VM that is higher than 10,000 IOPS.
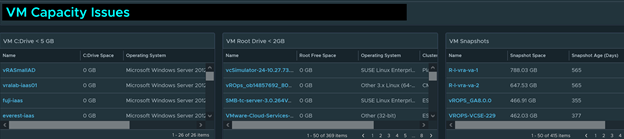
If I see any VM that has 0 capacity on the C: Drive or the Root Drive. The performance of the VM will suffer dramatically until you add more partition space. For snapshots, most of the time snapshots should not be older than 7 days.
Note: If this is blank you will need to enable the Guest File Free metric for VMs in all the active policies. This is not enabled by default in vROPS. Use this guide to enable this metric. http://www.vmignite.com/2021/02/vrops-8-how-to-enable-hidden-metrics-and-properties/
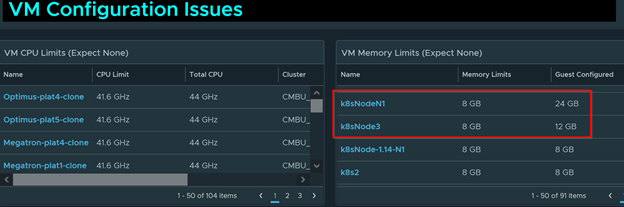
If you see any type of VM limits this is not a good sign. A limit on a VM basically means the VM won’t perform more than what the limit is set to. For example, the VM I highlighted below has a memory limit of 8GB. However, the configured memory is set to 24GB. Even thou the VM has 24GB of memory configured, it will only be consuming 8GB of it because of the 8GB limit set on the VM. You won’t get full performance until you remove the limit of the VM in vCenter. Hopefully you now understand why Limits are not good at all for any reason.
Monitoring Clusters
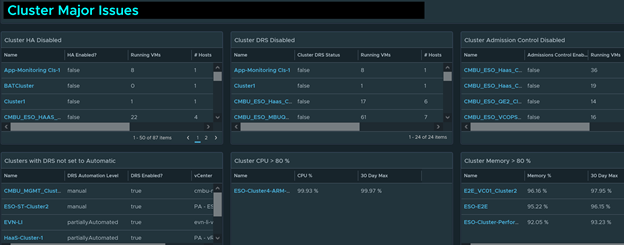
Cluster HA and DRS in mostly all cases should always be enabled. A large company could have 100s of clusters, it will be quite a nightmarish task to check all these manually. Luckily, I got you covered as all you need to do is look at my dashboard. Another thing to look for is DRS Policies not set to automatic. Although DRS is enabled, if it is not set to automatic, resource balancing will not automatically occur. This setting is often overlooked.
Monitoring Datastores
Any datastore that has high latency is not a good sign, most of the time it will affect the VM performance as well. Do not let your datastores run more than 80% utilized. A datastore that is out of space will cause outages.

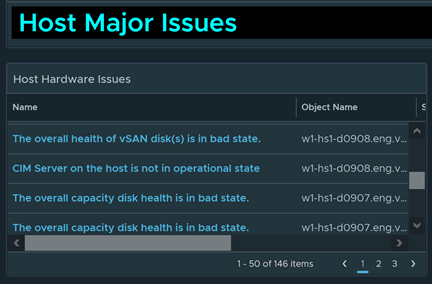
Monitoring ESXi Host
This is one of my favorite widgets because it reports back on physical ESXi host failures that vCenter detects. Customers have told me that this some times detects issues that even the vendor software didn’t even detect.
Download on VMware Code Exchange Here https://code.vmware.com/samples?id=5639#
Instructions on how to Import Dashboard
To import in version 7.0 and above
-
First unzip the file you just downloaded, it will contain a dashboard and a view file
-
Go to Dashboards > Actions > Manage Dashboards
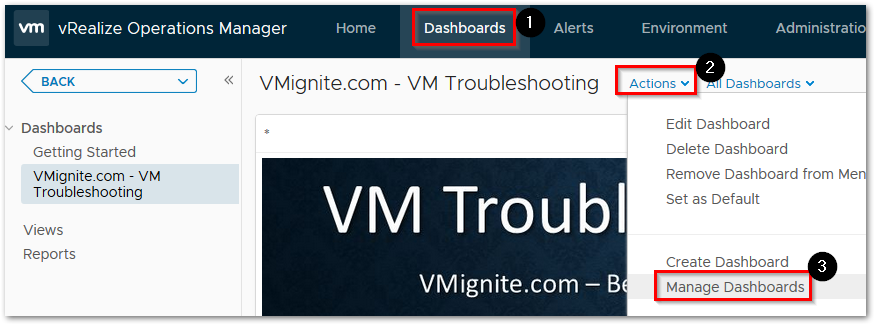
-
Hit the dropdown and select Import Dashboards. Import the Dashboard.zip file
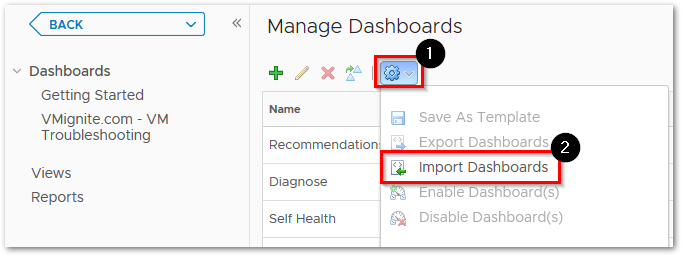
-
Next to go Views > Dropdown > Import. Import the View.zip file
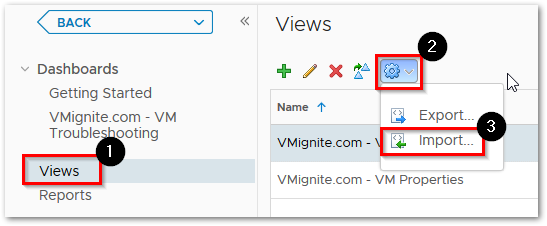
- If you get any errors during the process, make sure to click overwrite before importing
Hi,
I like the combined Dashboard. I have the following issues.
Under vCenter issues – vCenter Appliances Low Disk Space (All Partitions) . In this View I see all of the machines not just the Vcetners. Is that correct?
In vROPS Issues under Are all My Adapters collecting ? it is a empty View.
There are 2 View files View(104) and View(105). I imported both. Just want to confirm that both of them are needed?
Thanks
The new versions of vROPS broke the filter I used to show only vCenters only. To change it to vCenter only go edit the view I used and go to the Filter section. Clear all filters and add property > summary|configuration|Product is VMware vCenter Server. Yes both views are needed, make sure to replace any older views by checking overwrite.
What is the name of the View that I need to modify? This is what I have under VMignite
VMignite.com – Text vCenter Issues (pro)
VMignite.com – vCenter Alerts (pro)
VMignite.com – vCenter Server Disk Partition (pro)
VMignite.com – vCenter Stats (inv)(cluster)
VMignite.com – VMs vCenter Stats (inv)
Just want to add that I think I was able to fix it. I only uncheck “Add instance breakdown column (see data for column settings) ” box under Breakdown by TAB. I didn’t change anything under filtering. That was in VMignite.com – vCenter Server Disk Partition (pro) View.
Can you tell me what View is used for “Are all My Adapters collecting? (Monitor All Adapters) in vROPS issues?
You can check what view any widget is using by clicking on Edit and Click on Output data. Look for what view is selected
Hi
It seems that some of the widgets are empty and others are not. Could it be related to the Vrops license?
We have the Vrops advanced license and when looking at the empty widgets it says (pro)
Exampel:
“VMignite.com – VM CPU Contention > 5% (pro)”
Regards
Rasmus
Widgets are working, just there are no findings for that view. Which is a good thing.
Hi
Allright thank you, just wanted to be sure that it wasn’t an license issue 🙂