In this guide I will show you how to enable hidden metrics using vROPs 8.0 and above. There are over 300 combined metrics and properties for VMs out of the box. That alone is a lot of metrics for one object, but what most people don’t know is that there is an additional 200 hidden metrics for VMs as well. That is a total of 500 metrics/properties for Virtual Machines alone. I will also show you what hidden metrics I enable to get the best vROPs experience.
What we will be enabling?
Virtual Machine
- Guest File System Free (GB) – this metric displays the amount of free space left for each partition of the Operating System
- Subnet – displays the subnet information for the Virtual machine
- Gateway – displays the gateway information for the virtual machine
- Memory Guest Active (%) – a better metric to measure the memory the guest Operating System is using
How to enable hidden metrics and properties
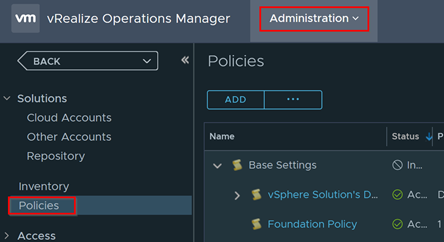
Go to Administration > Policies
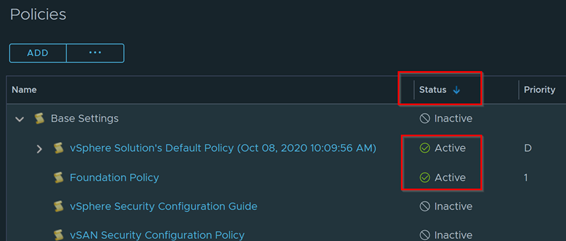
This should bring up a list of all policies. Click on the Status Icon to sort by which ones are active. In most cases, whatever changes we make to a single policy must be made again in all active policies. If you only have one active Policy then the process will be much simpler as you only have to make changes to one policy. In the example below we have two policies therefore we need to make changes to both.
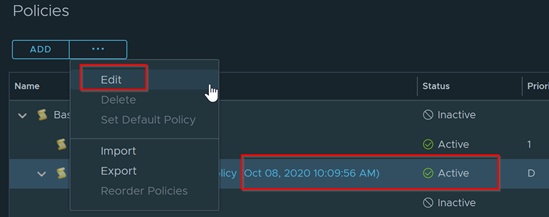
To edit the active policy, just highlight it and click on Edit
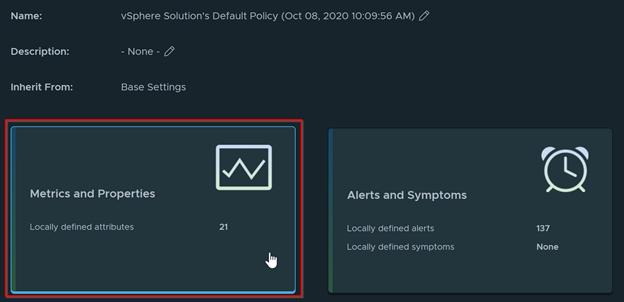
Select Metrics and Properties
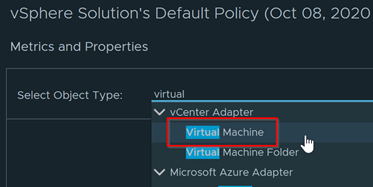
In the following example we want to enable the following VM Metrics and Properties: Guest File Free, Subnet, and Gateway for Virtual Machine. Under Object Type select vCenter Adapter >
Virtual Machine
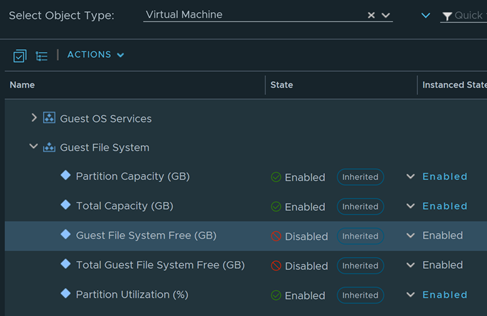
This will bring up all Metrics, Properties, and Super Metrics for Virtual Machines. Expand Metrics > Guest File System. Notice how the Guest File System Free (GB) is Disabled
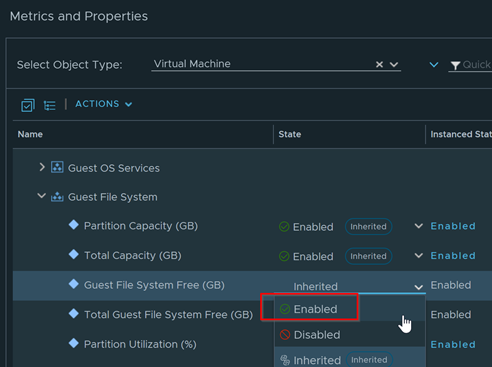
To enable the metric select the dropdown next to the metric and select Enabled. This will enable the metric in the next vROPS cycle.
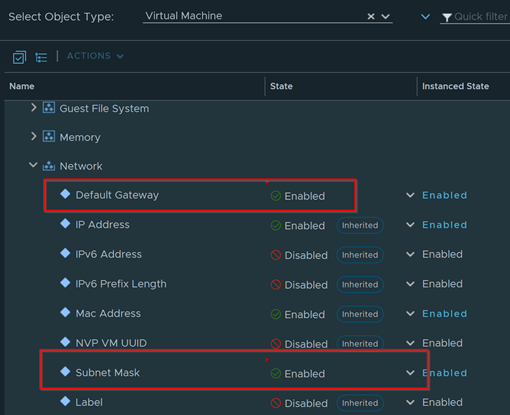
Repeat this process for Subnet and Default Gateway which is located under Properties > Network and Guest Active Memory (%) which is under Memory.

Once completed click on Save on the bottom of the screen. Give about 5-10 minutes and you will now have your new metrics and properties available.
Repeat this process for all active Policies as needed.
These are some really good metrics and I would think if more people knew about them they would get much more use. So the question is why are they inactive by default? DB bloat, impact to vms, impact to collectors? any insight would be appreciated.
Thanks,
-GB
In the early 6.0 days they were enabled. Later on they started disabling metrics to make vrops perform better. Therefore they turned off a few metrics by default. A lot were not needed, however these are ones i always enable for all my customers.