With the new features of 8.4, I was finally able to finish my Executive Dashboard the way I envisioned it. In one pane of glass, executives will be able to see how much capacity do they have left, what is my current inventory, how fast am I growing, does my current infrastructure have any cpu and/or memory bottlenecks, is my storage good in space and running at optimal speed, do I have any ESXi host down, is Cluster HA/DRS enabled, and does my VMs have enough resources to prevent any major outages. Read the user guide below to fully understand how to use the dashboard. This dashboard could also be a 24/7 critical monitoring dashboard as well. This dashboard should work with older versions as well, just won’t look as nice.
Download the Dashboard here: https://code.vmware.com/samples?id=7628
What the dashboard covers
Capacity
-
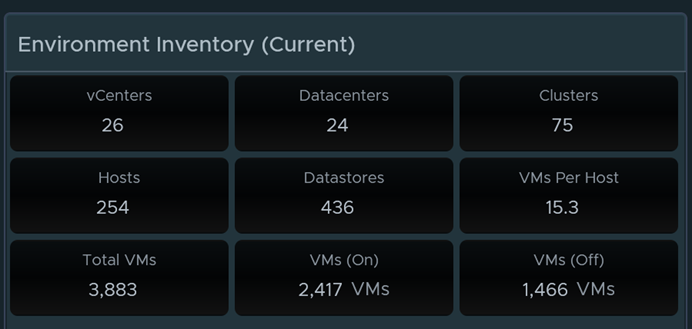
Inventory
- vCenters, Host, Clusters
- Datastores
- VMs (Powered On, Powered Off, VM to host ratio)
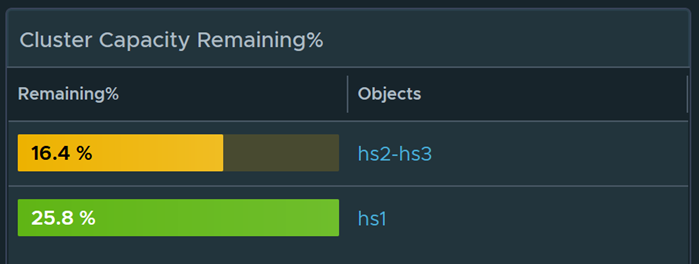
- Cluster Capacity Remaining
-
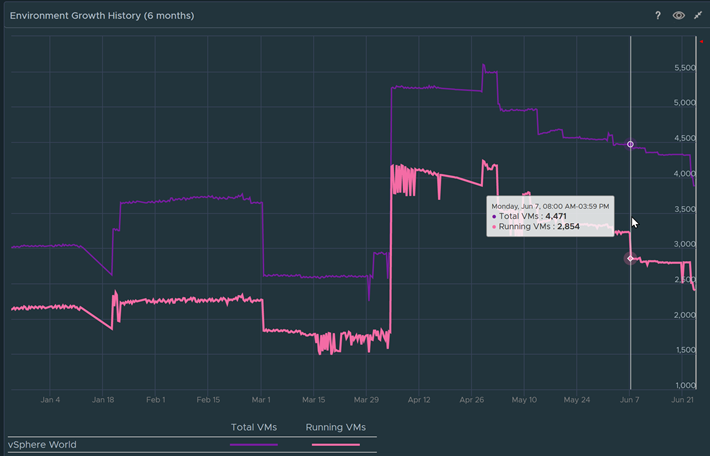
Capacity Growth in the past 6 months
Infrastructure Health
- Host high in CPU usage %
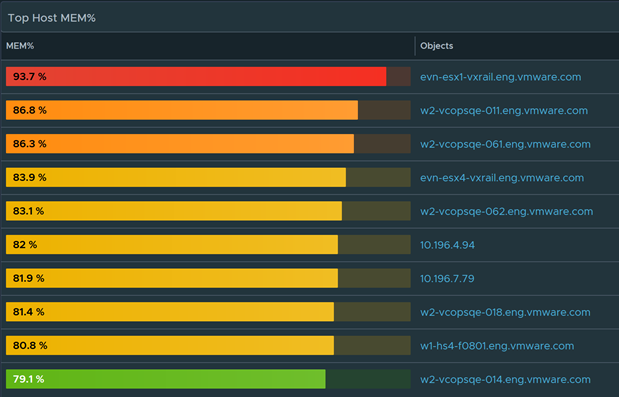
- Host high in Memory usage %
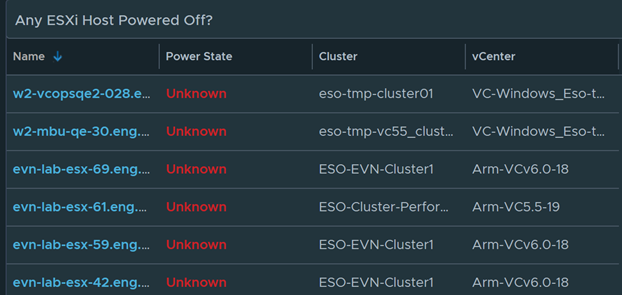
- Host that are down or powered off
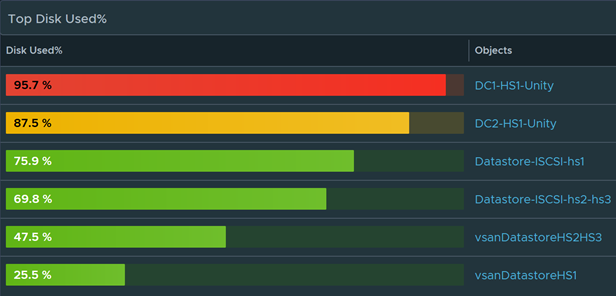
- Datastores out of space
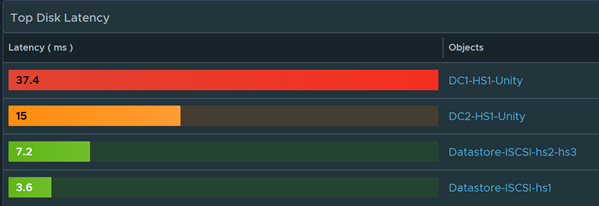
- Datastores with disk latency
-
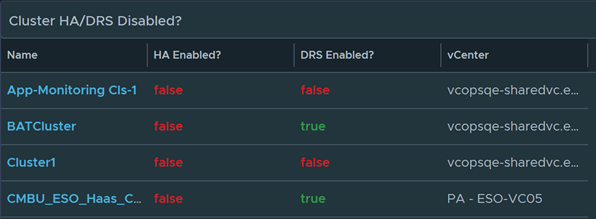
Clusters with HA/DRS turned Off
VM Health
- C: Drive low space
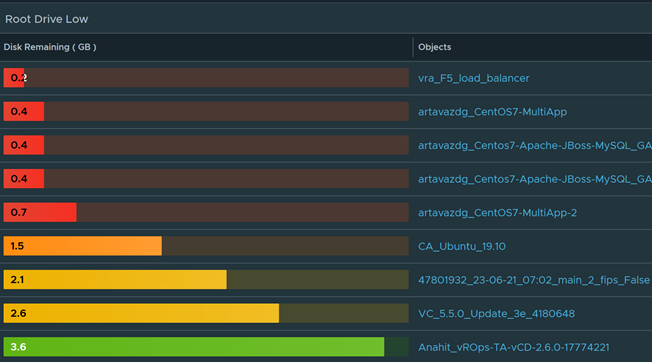
- Root Drive low space
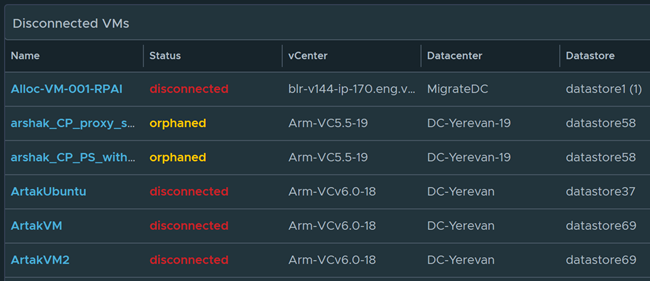
- Disconnected VMs
Note:
- The entire dashboard auto refreshes every 5 minutes, so you always have the latest updates. Therefore could also be used as a NOC dashboard
- You must be on vROPs 8.4 to have the best experience. This dashboard should work with older versions as well, just won’t look as nice.
-
You will need to enable these metrics to see C: Drive space low and Root drive space low.
http://www.vmignite.com/2021/02/vrops-8-how-to-enable-hidden-metrics-and-properties/
- To remove any cluster, host, environments you don’t want to see in any of the widgets, just edit the widget and filter it out.
-
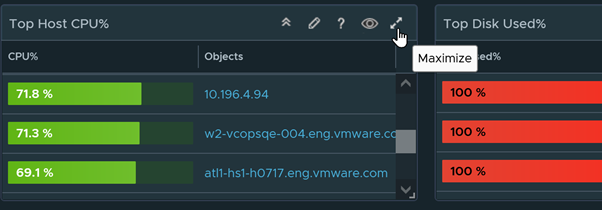
Click on the expand button on any widget to see more values and to maximize the window
User Guide
View what you have in your entire environment
Capacity Remaining % is calculated by the lowest remaining value for CPU/Memory/Disk remaining. By default, it will use actual usage% for CPU/Memory/Disk. If you like you can adjust it to allocation model in the policies. You can also add a buffer as well to CPU/Memory/Disk. I set the thresholds for 20% for yellow, 15% for orange, and 10% for Red. This should all be green.
Measures VM growth in the past 6 months. Hover your mouse over the graph to see exact numbers of VMs at a certain time. Measures Total VMs and Running VMs
Make sure all ESXi Host utilization is green. Anything above 80% is yellow, 85% is amber, and 90% is red. Having high utilization may cause CPU/Memory bottlenecks. And if you reach the max, it may cause outages to VMs.
If the Power State is Unknown, this is bad. It means that the ESXi Host is either disconnected, orphaned, or not responding. This is most of the time not planned therefore you should address this immediately. If the Host is Powered Off, this is usually planned.
Do not let any Datastores be in the red zone. Even when you think it was planned and is under control, I have seen many customers fill up disk space which caused outages to many VMs that are on the same datastore. Thresholds are 85% yellow, 90% Orange, and 95% for red.
Disk latency can degrade performance for VMs on that datastore. Thresholds are 10ms for Yellow, 15ms for Orange, and >20ms for Red.
This widget will catch if one of the following is turned off Cluster HA or Cluster DRS. If this is blank, that means none are found which is a good thing
Having no space on the C: Drive for Windows OS and Root Drive for Linux OS can cause outages and degraded performance. Make sure no VMs get to that point. You should see values here no matter what. If you don’t you must enable the metrics in the policies. http://www.vmignite.com/2021/02/vrops-8-how-to-enable-hidden-metrics-and-properties/
Any VMs shown here should be addressed immediately on why they are not disconnected. If this is blank, that means none are found which is a good thing
Instructions on how to Import Dashboard
To import in version 7.0 and above
-
First unzip the file you just downloaded, it will contain a dashboard and a view file
-
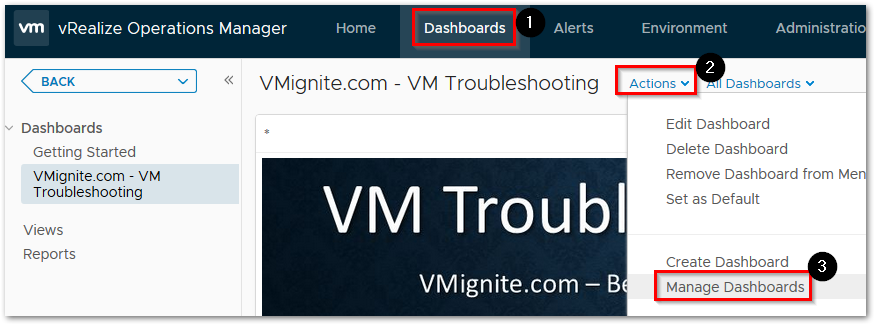
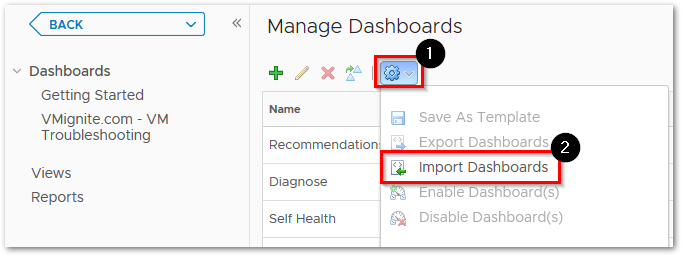
Go to Dashboards > Actions > Manage Dashboards
-
Hit the dropdown and select Import Dashboards. Import the Dashboard.zip file
-
Next to go Views > Dropdown > Import. Import the View.zip file
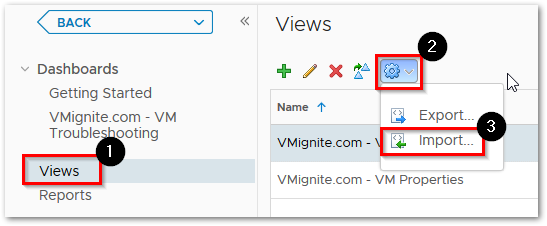
- If you get any errors during the process, make sure to click overwrite before importing
Would you please explain why in view we see (exe) & (pro)?
Is there a professional version?
Reason is for my own filtering. I have over 30 dashboards I created and over 250 custom views I’ve created. To know what view goes with what dashboard takes time to reverse engineer it. Therefore I came up with this additional filtering for views.
How can this dashboard be altered to accommodate a custom group? This dashboard would be great for one of our custom group/env teams.
You would clone the dashboard and add an object selector. Filter the object selector to your custom group category. Then you would edit the dashboard and have all widgets receive from the object selector (interaction menu). Last step is to edit each view and turn off Self Provider in each widget that has it turned on.