In this post I will show you how to monitor over 40 out of the box services using no credentials and without an agent. On top of that I will show you how create an alert when the service is down and how to create a custom group based on VMs that run that service. Enabling this feature allows you to monitor Up/Down of critical services such as IIS, SQL, Apache, Active Directory, and more. On top of that it will provides you with other useful metrics such as ports, how many outbound/inbound connections, and more.
Prerequisites
For maximum results you should be on the following Pre-requisites below
- vROPS 8.6 or above (version 8.1 is minimal)
- Have all your VMs run VMtools 11.1.0 or above
- Be on vCenter 67u3G and above
- ESXi Host with versions 6.5p5 and above
- For full requirements read the following https://kb.vmware.com/s/article/78216
How to Enable Credential-Less Service Discovery
From the left menu, click Configure > Application Discovery > Configure Service Discovery option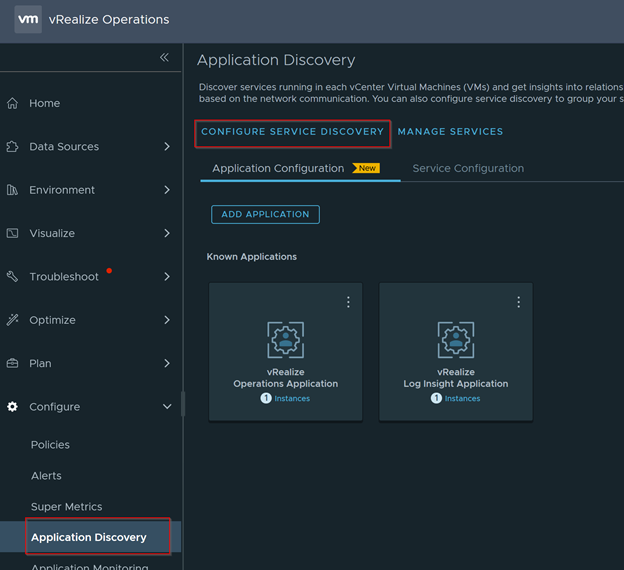
Expend vCenter and Edit the vCenter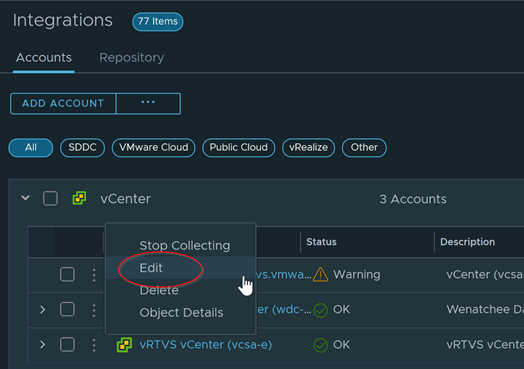
Click on Service Discovery Tab. Then Enable Service Discovery and check the box Enable Application Discovery. Click on Save when done 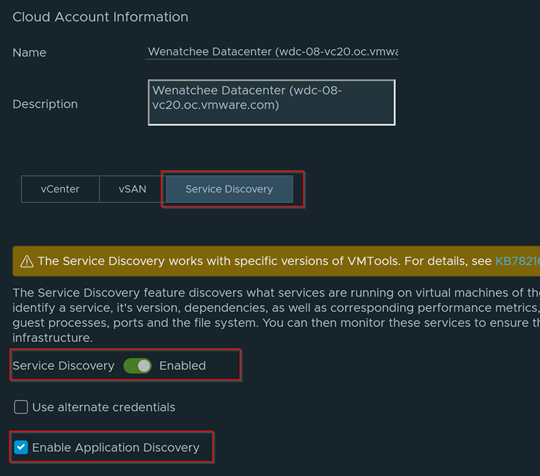
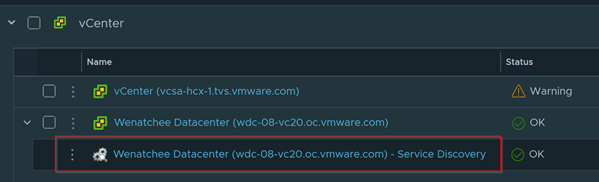
Expand the vCenter we just edited. You should now see a Service Discovery option below it. Edit the Service Discovery by clicking to the left of it and selecting Edit
Expand Advance Settings and make sure Credential-less service discovery and application discovery are both Enabled. Then click on Save 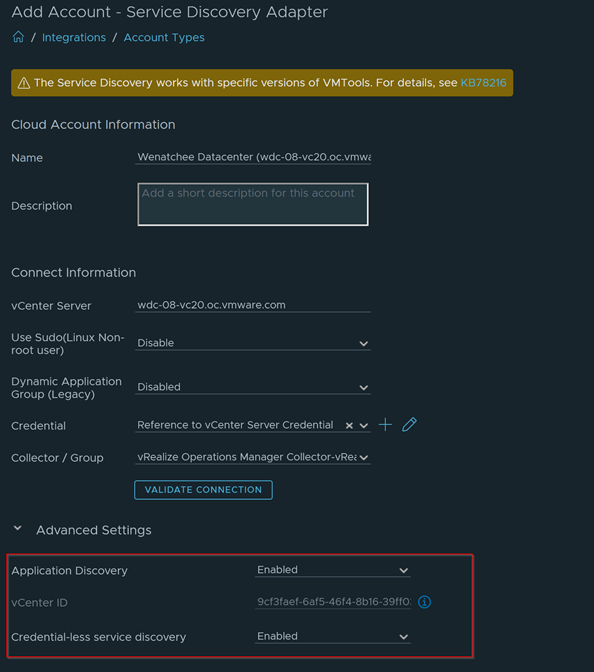
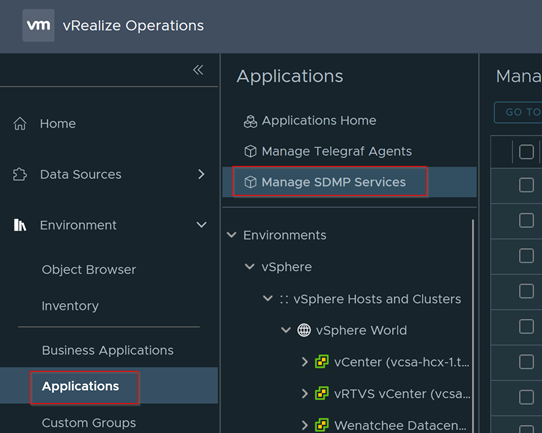
Give it at least 30 minutes for it to do some scanning. Now go to Environment > Applications > Manage SDMP Services 
Refresh the page. If successful, you would see a status of Credential-less under Authentication Status. If known services are detected, you can expand the VM to see what services are detected. 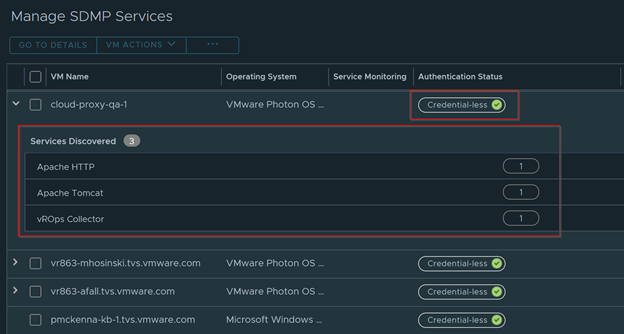
How to scan services using Credentials
For VMs that failed, make sure they meet the requirements mentioned in the KB article given. You can also try entering credentials manually as well by selecting the VMs that failed and selecting the Provide Password option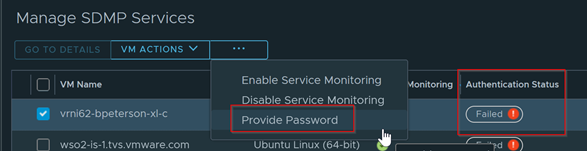
To provide credentials for multiple VMs, the easiest way would to be provide credentials from the Service Discovery page. 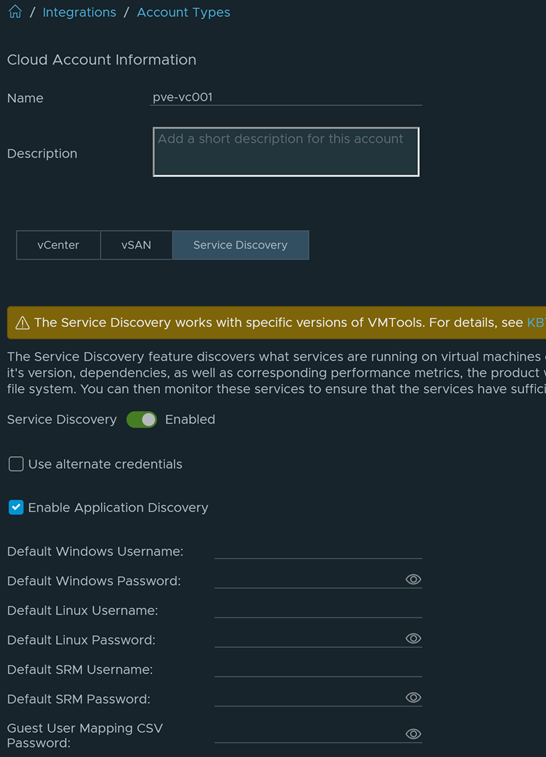
How to view what Services are discovered
You can easily see what services are available and discovered by going to Configure > Application Discovery > Service Configuration and then seeing how many of each are discovered.
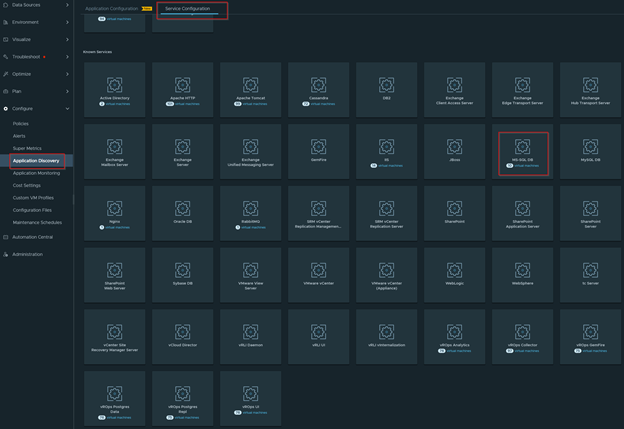
If you click on one of the services with VMs discovered it will lead you to a page that list all the VMs with that service. 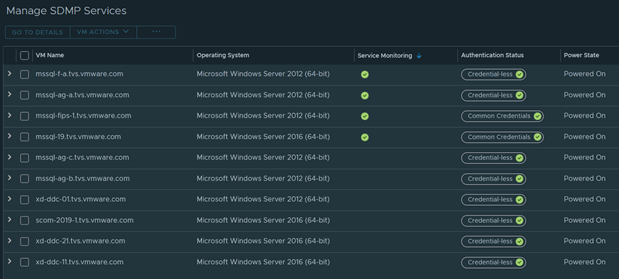
How to add your own Service monitoring
There will be services that are not well known and won’t be included out of the box. However, in the following steps we will show you how to add your very own service to have it monitored.
Go to Configure > Application Discovery > Service Configuration

Click on Add Service and fill in the Process Name, Port, and Display Name and click on Save when done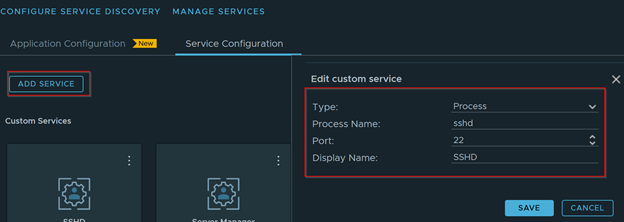
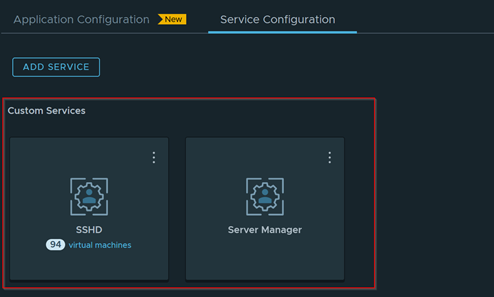
You should now see your Custom Service under Custom Services
How to add additional Service Monitoring metrics
You can also enable service monitoring and collect important metrics such as the amount of CPU and memory consumed by the service plus how much disk I/O the service is generating. We can also collect the number of connections to and from the service, what ports that the service is listening on, version information, and more. See a full list in the link below
To provide additional metrics go to Environment > Applications > Manage SDMP Services
This will bring a list of VMs. Check all the VMs you want to apply Service Monitoring and then select Enable Servide Monitoring from the dropdown.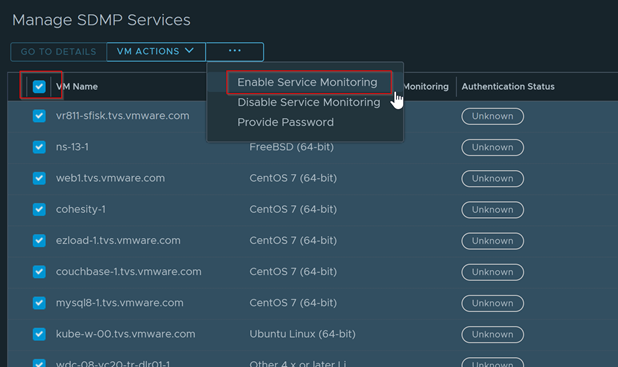
Service Monitoring checkbox should now be shown next to the VMs you selected. 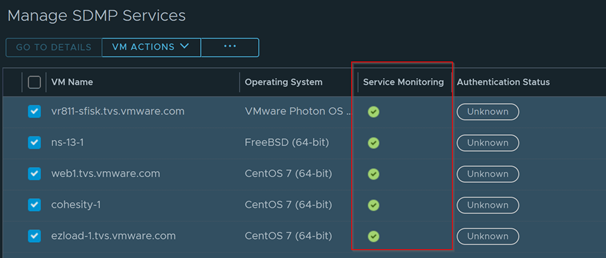
Below is a view that I created that shows metrics that are pulled once successful. You can see besides up/down I can get Ports, Incoming/Outgoing Connections, Paths, etc). 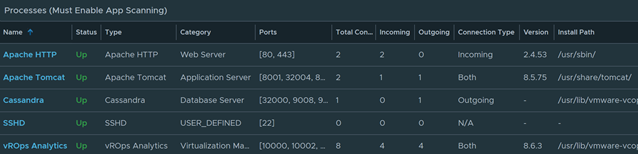
How to create a custom Group based on Services
In the following example we will create a new custom Group for any VM that is running SQL. This group can be used for reporting and dashboarding purposes.
We will create a new custom group by going to Environment > Custom Groups > Add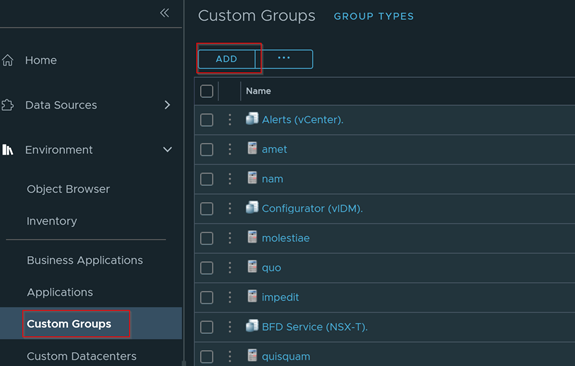
Provide a name and group type. Make sure the Keep Group Membership up to date is checked. This will ensure that this groups gets auto updated. 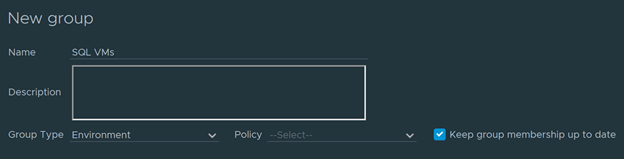
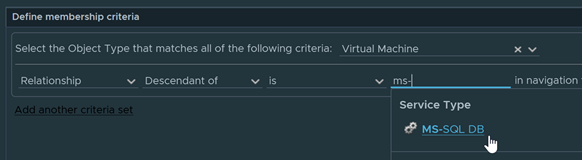
Using the previous steps above, we know that our Service is called MS-SQL DB. Therefore select Virtual Machine as our object type and fill Relationship Descendent of is MS-SQL DB.
Click on the Preview button to make sure the results are correct and then click on Close when done. Click on OK to save the Group. It is now ready to be added to a dashboard or report. 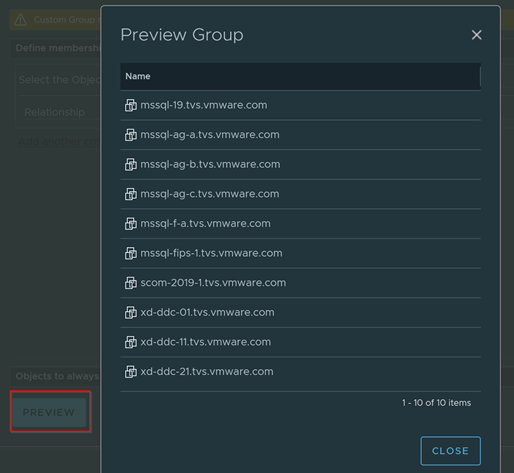
How to create an alert when a specific Service is down
In this example we will create an alert when a SQL service is down. This will only work for VMs that have MS-SQL discovered.
We will create the alert, go to Configure > Alerts > Alert Definitions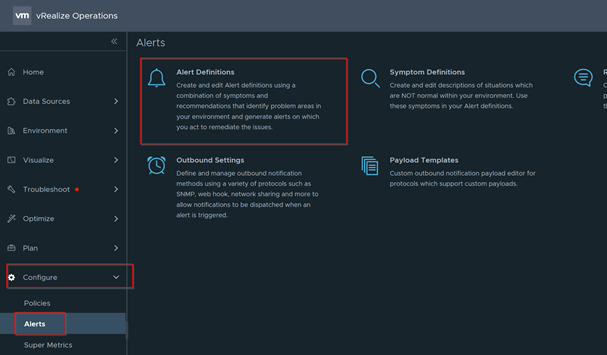
Click on Add to create a new alert definition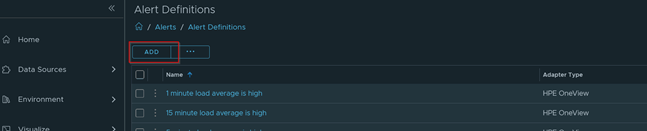
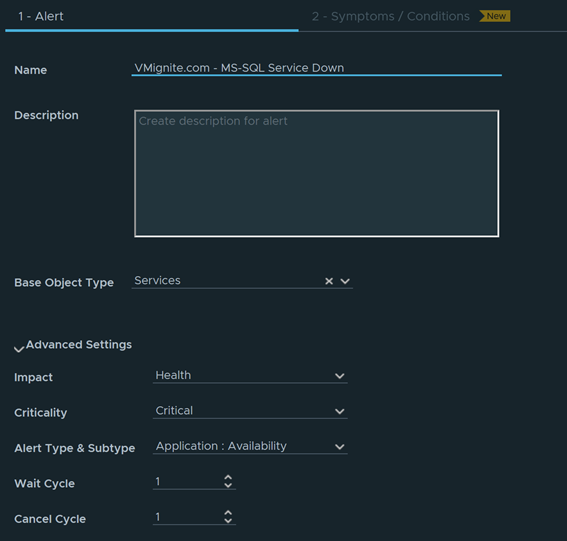
Configure the following
- Provide a name and optional description
- Choose Base Object Type: Services
- Expand Advanced Settings and change Alert Type & Subtype to Application: Availability
-
Click on Next when done
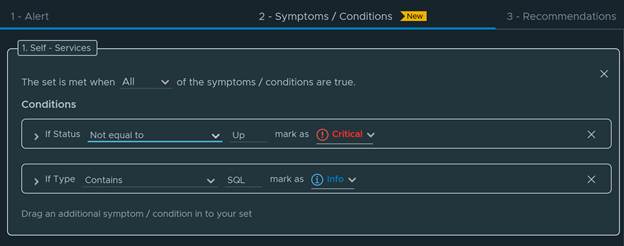
Expand Properties and drag the property Status and Type until it shows up on the left side in the same box grouping as shown below. 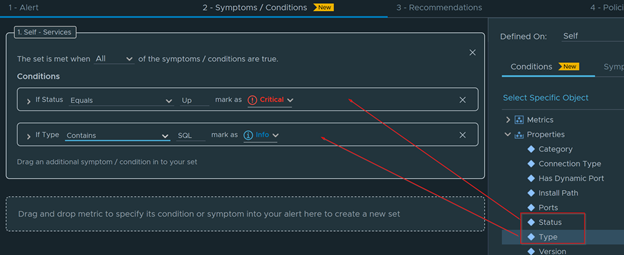
Configure the following
- Make sure All is selected on the top drowdown
- Set the condition to Status Not equal to Up and mark as Critical.
- Set Type Contains
SQL - Click on Next when done
Click on Next and Add an optional Recommendation. Then click on Next again 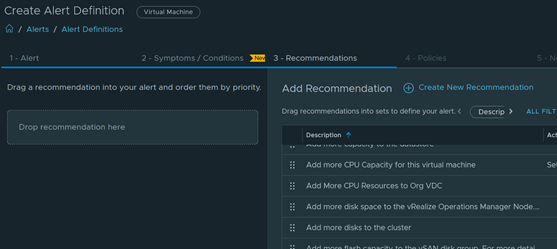
In the Policies section. Make sure to enable it on all policies and click on Next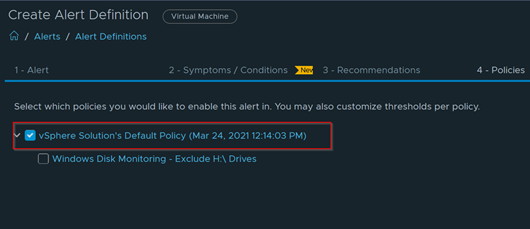
If you would like to forward this out to a third party such as Email, Service Now, and/or Ticketing System you can select it here (Note: this must be preconfigured). 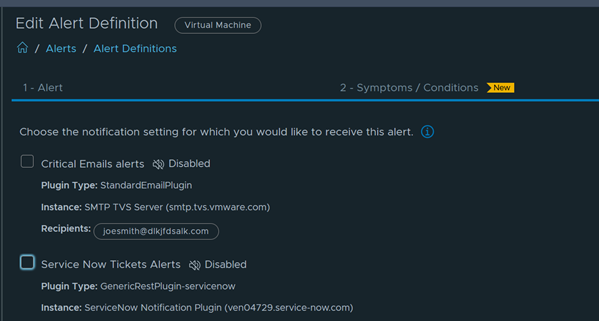
Click on Create when done. You should now receive alerts whenever a SQL service is down.