This is a must-have dashboard for those who wish to monitor vCenter Appliance partition disk space usage and vROPs disk space usage filling up as well. Both are critical as it can lead to an outage on both products. This dashboard covers the following.
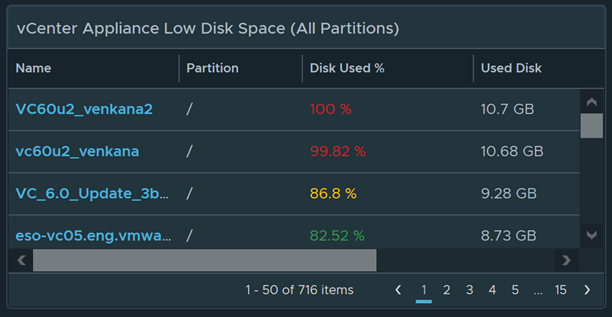
- Are my vCenter Appliance Disk partitions filling up?
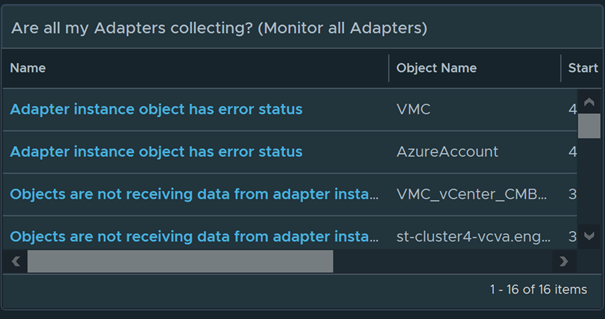
- Are all my vROPS adapters collecting?
- Is my vROPS out of space?
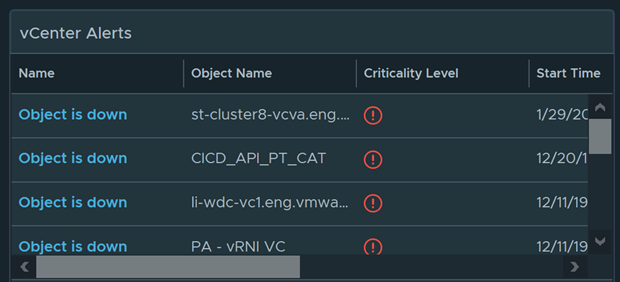
- vCenter Alerts (10+ Alerts)
- vROPS Alerts (30+ Alerts)
Below is a user guide and a walk through of the dashboard. The dashboard auto refreshes each widget every 5 minutes.
This Dashboard is not integrated with the Healthchecker Dashboard. Download below
https://code.vmware.com/samples?id=5639#
See what adapters are not collecting. This widget monitors all configured adapters being collected by vROPS
Monitor vROPS Disk space issues. As some of you are already aware, if you run out of space, vROPS will go down. 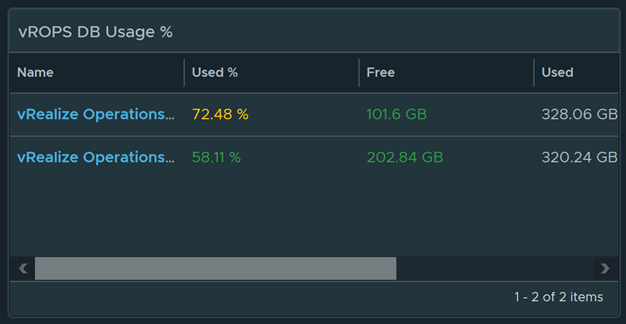
Monitor over 30 alerts for vROPS. In the below example, it even detects memory swapping.

Monitors all partitions of the vCenter Appliance and sorted by the highest disk usage %. This alone makes this dashboard a must-have dashboard
Monitors over 10+ Alerts for vCenter Server
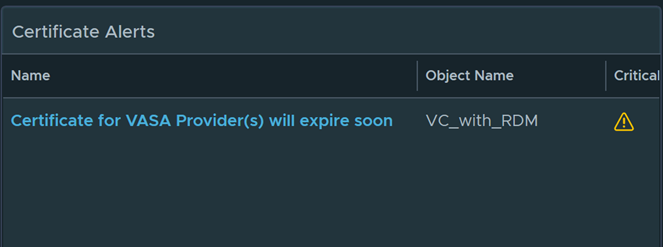
This widget monitors Certificates for vCenter and other products as well
To import in version 7.0 and above
-
First unzip the file you just downloaded, it will contain a dashboard and a view file
-
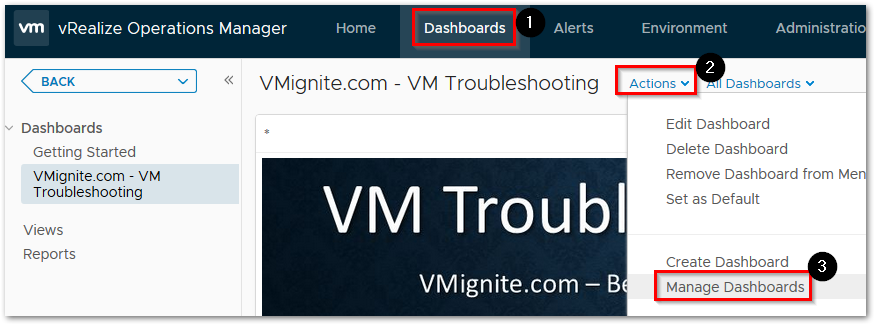
Go to Dashboards > Actions > Manage Dashboards
-
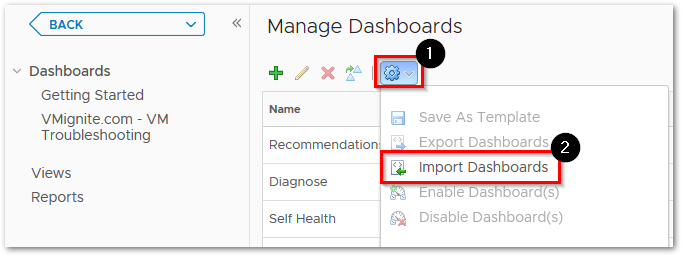
Hit the dropdown and select Import Dashboards. Import the Dashboard.zip file
-
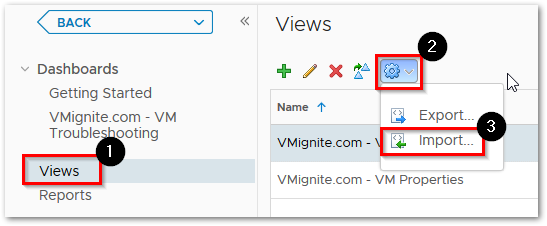
Next to go Views > Dropdown > Import. Import the View.zip file
This looks like a great dashboard and fills a monitoring need. I installed it on a vrops 8.1 instance in my lab and the adapters, vrops alert, vcenter alert and certificate widgets all show “no results found”. Is there something else that needs to be done besides importing the views and dashboard ?
Todd! It has been a long time. Hope you are doing well. Did you import the views? Make sure to select overwrite when importing
I did import the views and I re-imported them selecting overwrite and have the same results. The vcsa disk space, vmware environment inventory and the vrops db usage widgets are populated but everything else is empty.
Exactly the same issue. Thanks
I am combining this with my new Healthchecker Dashboard so this dashboard won’t be needed. Stay posted
Hi Lan,
Any update on this?
Thanks
Added to my latest vROPS Health Checker Dashboard http://www.vmignite.com/2021/02/vrops-vsphere-health-checker-dashboard-2-0/