Management is always worrying about infrastructure uptime. They usually want to know if there were any unplanned outages in the last week? What about the past 30/60/90 days? And if there were any outages, what caused it? To answer these questions I have created the Cluster Uptime Checker dashboard. This dashboard will tell you the uptime % of all your clusters in the past 3 months by default. If the uptime is not 100% for the entire cluster, you can use the dashboard to identify which ESXi host were down for the past 7 days and even 30/60/90 days. You can also use the dashboard to identify if the ESXi host was down because of hardware failures, network failures, ip conflict, etc. Below is a guide on how to use the dashboard.
Download Here: https://code.vmware.com/samples?id=7375
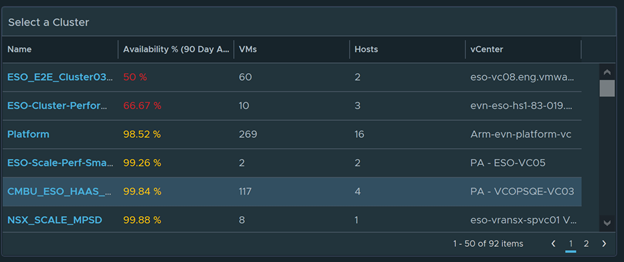
Clearly view which vCenter Cluster had an ESXi Host outage in the past 3 months. Just select the Cluster to view which ESXi Host were having outages and when exactly did it happen. (Note: do not click on the name of the Cluster, click on the availability numbers to select it)
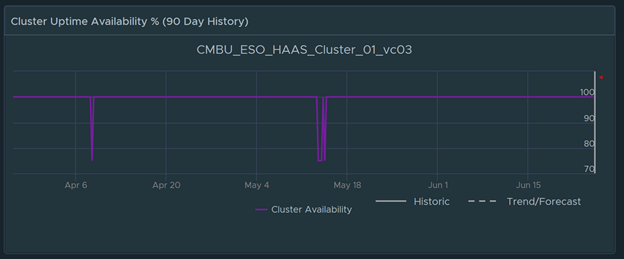
The next widget clearly shows I had at least one host outage sometime in April and in May.
The next widgets show me which Host were down in the past 7/30/60/90 days. As you can see from the diagram, there were uptime issues in the past 60 and 90 days caused by two ESXi Host. Select the Host from the list to see details on why it was down.

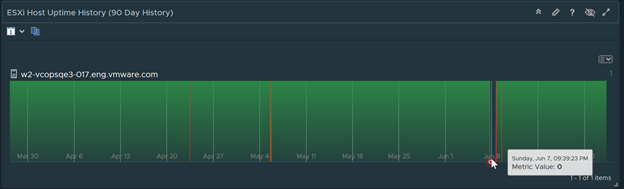
After selecting an ESXi Host, I can see see when the host was down. I can hover over with my mouse on the graph to get the exact date and time.
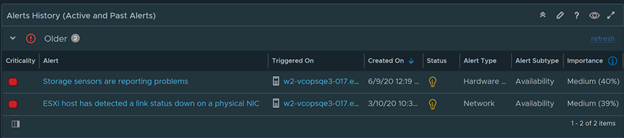
The Alerts widgets shows active and past alerts. I can quickly see there are storage sensor problems and a possible Physical NIC was down that could has casued the outage.
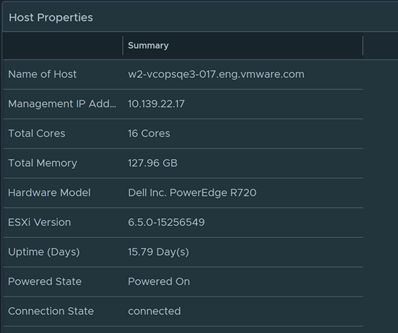
As an added bonus I even included all the properties of the ESXi Host so I can know which model, BIOS information, settings, etc
To import in version 7.0 and above
-
First unzip the file you just downloaded, it will contain a dashboard and a view file
-
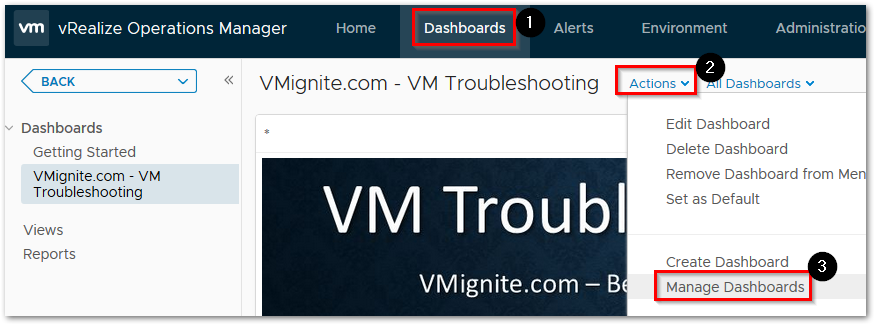
Go to Dashboards > Actions > Manage Dashboards
-
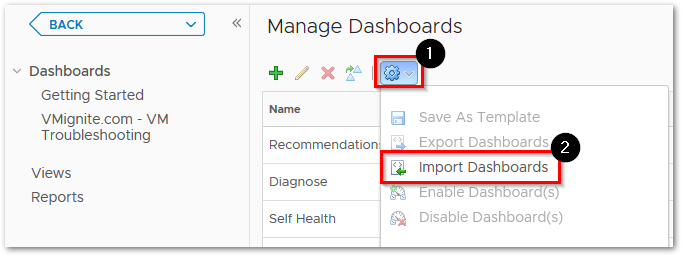
Hit the dropdown and select Import Dashboards. Import the Dashboard.zip file
-
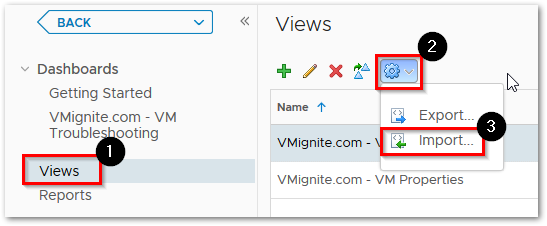
Next to go Views > Dropdown > Import. Import the View.zip file