Now that remote work is at an all-time high, monitoring and automating tools are now needed more than ever. Luckily vROPS is a superb automating and monitoring tool. Yes, vROPS is an automating tool. In this post I will show you features that makes vROPS superior to any other monitoring product out there. Through my 7 years of working with Vmware, customer have repeatedly shown me competing monitoring products (SCOM, Solarwinds, etc) and have asked me to show them why vROPS is better. All it takes is a quick 30-minute demo with me and they instantly see why. Here is a list of features on why vROPS is the best monitoring solution out there for your virtual and cloud environment. Before even considering other monitoring products, make sure to compare if they have these 15 features. I am pretty sure they don’t.
-
Automate anything! – in less than 5 minutes you can automate any alert you create or an alert that is preexisting to an action you define. Example of Actions are: power off VM, restart host, add more CPU, Move VM to another host, or even an entire VRO workflow (VRO adapter must be installed). You can also write your own actions using python. I already wrote a guide on how easy it is to automate anything in vROPS.
http://www.vmignite.com/2022/09/how-to-automate-anything-with-vrops/ -
Ability to create powerful Dashboards – I have heard many people say dashboards are overrated. This is because they have seen a lot of mediocre dashboards. The 30-minute demo that I mentioned earlier I only showcase 4 dashboards to the customer: a proactive dashboard, troubleshoot a VM in a minute dashboard, one dashboard that covers inventory, and a 24/7 Critical monitoring dashboard. Two of the dashboards can be downloaded on my site. When it comes to dashboards, no other tool out there offers more powerful dashboards features than vROPS. Download some of the free ones on my site and you will understand why vROPS is so powerful. Also, there is link to other free dashboards shared by the community.
-
Super Metrics – you can take metrics and properties and create an entire new metric using formulas and logic. This provides you with unlimited amount of new metrics that you can create. For example, you can create a super metric that counts how many hosts are in Maintenance mode in a vCenter, how many VMs have CPU usage greater than 80%, etc. Download some already created super metrics here.
-
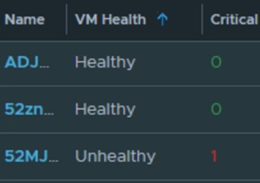
Create your own Custom Metrics – you can combine many conditions to create your own custom metrics. For example, if your boss wanted a simple tag next to a VM that says whether it is healthy or not healthy. The Healthy tag would apply based on 5 conditions (CPU is low, Memory is low, Disk has plenty of space, and disk performance is good) and if anyone of those is bad than tag it with an Unhealthy tag. Sounds super useful right? Well luckily for you, I already wrote a post on this. Read this post to see what I mean on why this feature is super powerful and useful.
http://www.vmignite.com/2019/04/vrops-7-5-using-custom-groups-to-create-a-custom-health-metric/
-
Predict the future – that’s right you can see what happens in your environment before it happens. For example, what if you added 100 more VMs in the next month. Can your cluster support it? If not, then why? Will CPU, Memory, or disk run out first? vROPS allows you to see capacity stats based on future conditions you set. See the post below to see what I mean. As a bonus it will also show you how much it will cost you if you move it to the Cloud as well.
http://www.vmignite.com/2019/01/vrops-6-6-what-if-analysis-guide-future-capacity-planning/
-
More metrics for vSphere than any other product – Other products out there uses some of the common metrics as well, but no product has more metrics for your vSphere environment than vROPS. For example, take Virtual Machines, this alone has 500 metrics/properties (300 are active, 200 are hidden). Most people don’t know much about hidden metrics. To find which ones are hidden see this post I wrote.
http://www.vmignite.com/2016/02/vrops-6-how-to-enable-hidden-metrics-and-properties/
-
Does Compliances – a big gem of vROPs that most of my customers didn’t know existed is compliance. You can automate the compliance checks for VMs, Host, vCenter, and vSwitches based on today’s latest standards such as PCI, HIPA, DISA, etc. With the newer versions you can just enable it from the Home Page > Quick Start > Compliance (Under Manage Configuration). For older versions just use my link below
http://www.vmignite.com/2017/09/vrops-6-6-how-to-install-and-enable-pci-compliance/

-
Monitors 3rd Party as well for an All in one solution – why buy a monitoring solution for every hardware you have out there (Example: Cisco Switch, EMC storage, HP ILO, etc) and have to login to multiple applications when vROPS can monitor all of it and display it in a single dashboard. Visit the marketplace to see what other products vROPS monitor. Over 60 vROPS management packs can be found today.
-
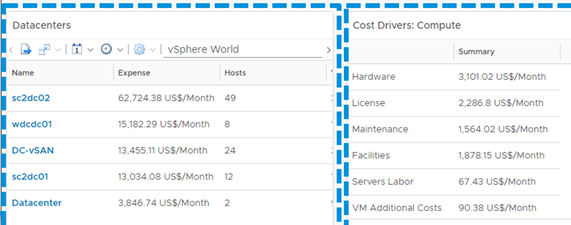
It can do automated billing and Cost metrics! – that’s right you can do cost analysis for Physical servers, licensing cost, labor cost, etc directly from vROPS. Combine that with vROPS automated scheduling of reports and you can bill customers every month automatically. Just check out some of the cool out of the box cost analysis below.
-
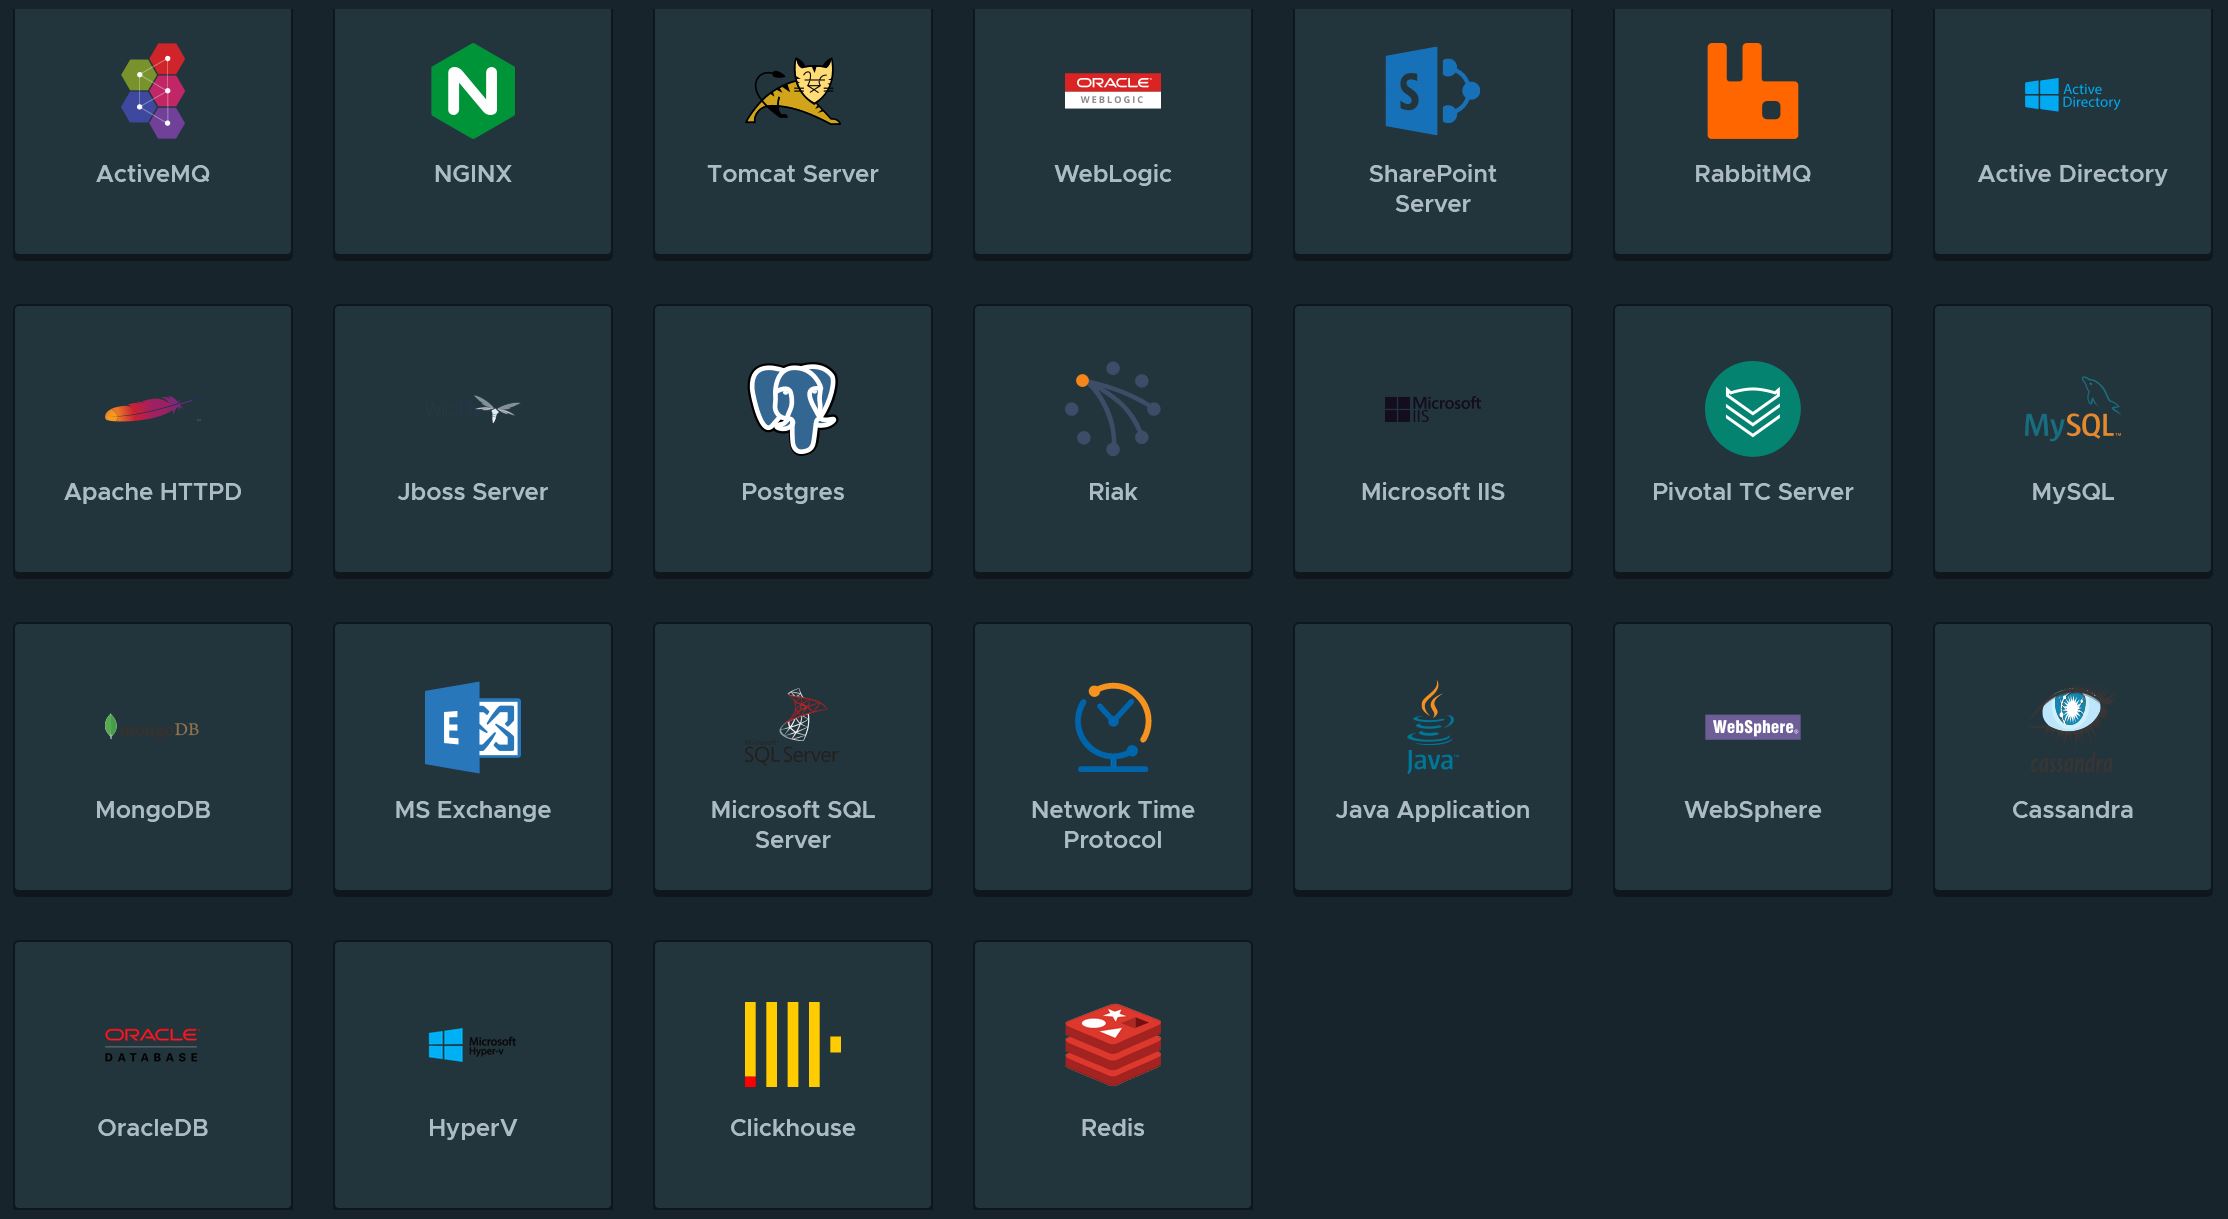
Monitors Applications – monitor 20 applications for free including exchange, IIS, SQL, sharepoint, and Active Directory
https://virtualg.uk/vrops-7-5-setting-up-the-new-telegraf-application-monitoring-feature/
https://vnuggets.com/2019/10/21/vrealize-operations-application-monitoring/
-
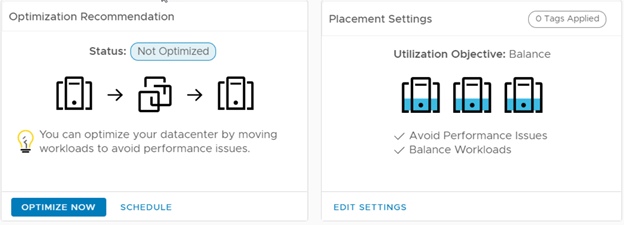
Workload Optimization – balance your environment workload based on intent. Such as optimizing application performance, save money on licensing, and driving infrastructure cost for example. Best of all you can schedule this for off peak hours if you want. Below are links to read more about it. Also sent a link on how it integrates with vRA
https://blogs.vmware.com/management/2018/04/workload-optimization-key-self-driving-datacenter.html
-
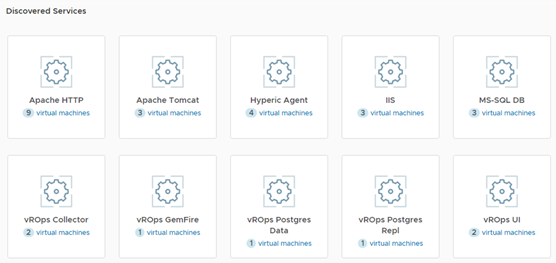
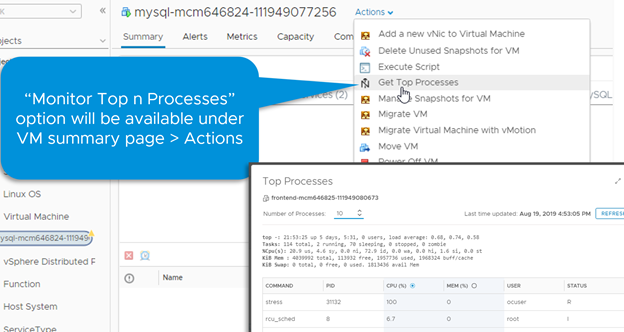
Agent free service and process discovery – comes with 41 known services by default and you can add your own services to discover even more. You get all of this with only VMware Tools, no agent is needed. As an added bonus, you will also be able to execute scripts directly to the OS once this is done and search for top processes running. The following blog post shows you how to do everything.
vROPS – How to monitor Services using no agents and no credentials
-
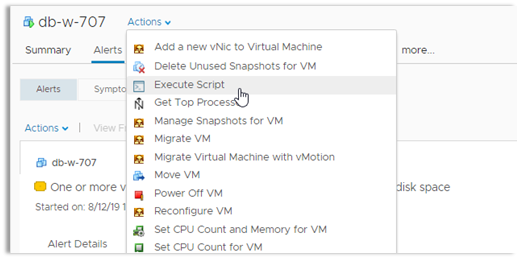
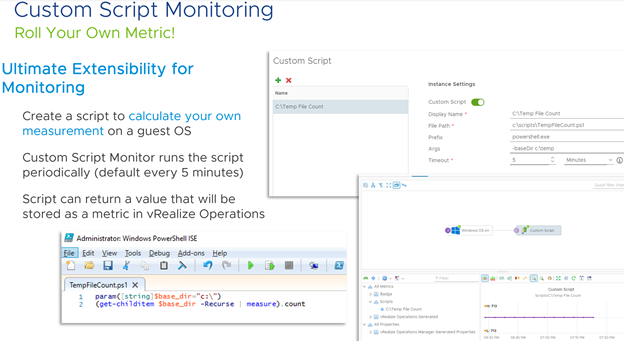
Ability to execute scripts in the Guest OS – you can do this agent free by following the steps above or with the telegraf agent installed you can create a metric based on a script
-
Ability to create alerts based on Events – Another hidden gem that most people don’t realize vROPS can do is create an alert based on Events. Learn how to do this here.
-
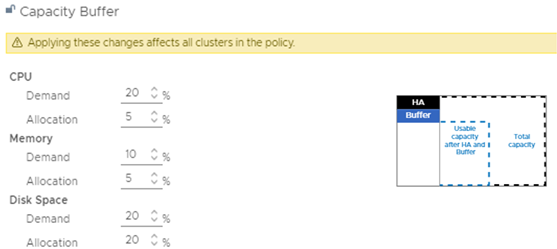
Ability to accurately get capacity numbers – so what is the best way to define how much capacity I have left in my environment? The easiest way is by defining a VM size such as (4 CPU, 8GB RAM, and 100GB of Disk) and knowing how many more of those can I build in my Cluster. Now to make it even more accurate, you can add some buffers to CPU, memory, and/or disk on the Cluster as well so that it won’t base it on 100% utilization. Capacity buffers are found in Policies and you must be in vROPS 8.0 or above. Below on how to setup Custom Profiles
http://www.vmignite.com/2019/05/vrops-7-5-how-to-create-a-custom-profile-metric/
-
Ability to Rightsize VMs and Reclaim resources –
Reclaim powered off VMs, Idle VMs, Orphaned Disk, old snapshots, and oversized VMs. It also does a cost analysis on how much money you will savehttps://blogs.vmware.com/management/2020/01/rightsizing-vms-with-vrealize-operations.html

-
Ability to easily ping and monitor any IP address, almost any DNS names, a complete subnet, or even a range of IPs
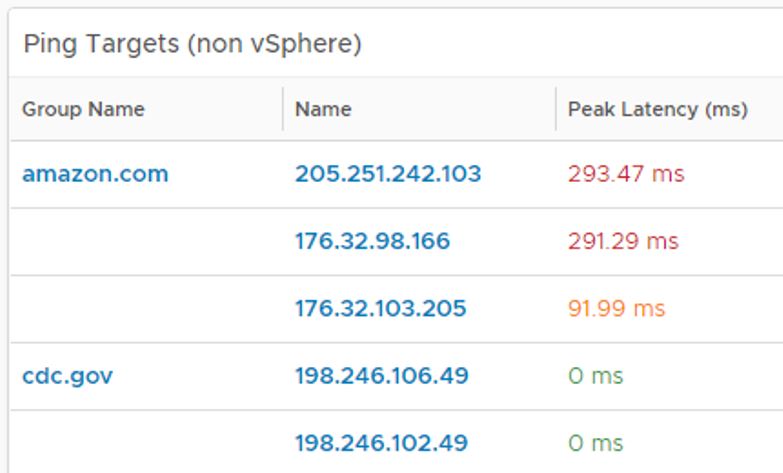
You must have vROPS 8.2 or above for this feature. All you need to do is activate the adapter and configure what you would like to monitor. Installing and setting up the ping adapter is so easy that is becomes a no brainer on why not to use it. It also measures latency and packets drops as a bonus. It is highly recommended to use it to ping critical URLs, Physical servers, switches, and more. See my guide here on how to do so http://www.vmignite.com/2020/12/2123/ -
Schedule Automated Task – Automation Central allows you to automate task such as rebooting VMs, reclaiming resources, and rightsizing VMs in a recurring schedule you choose.
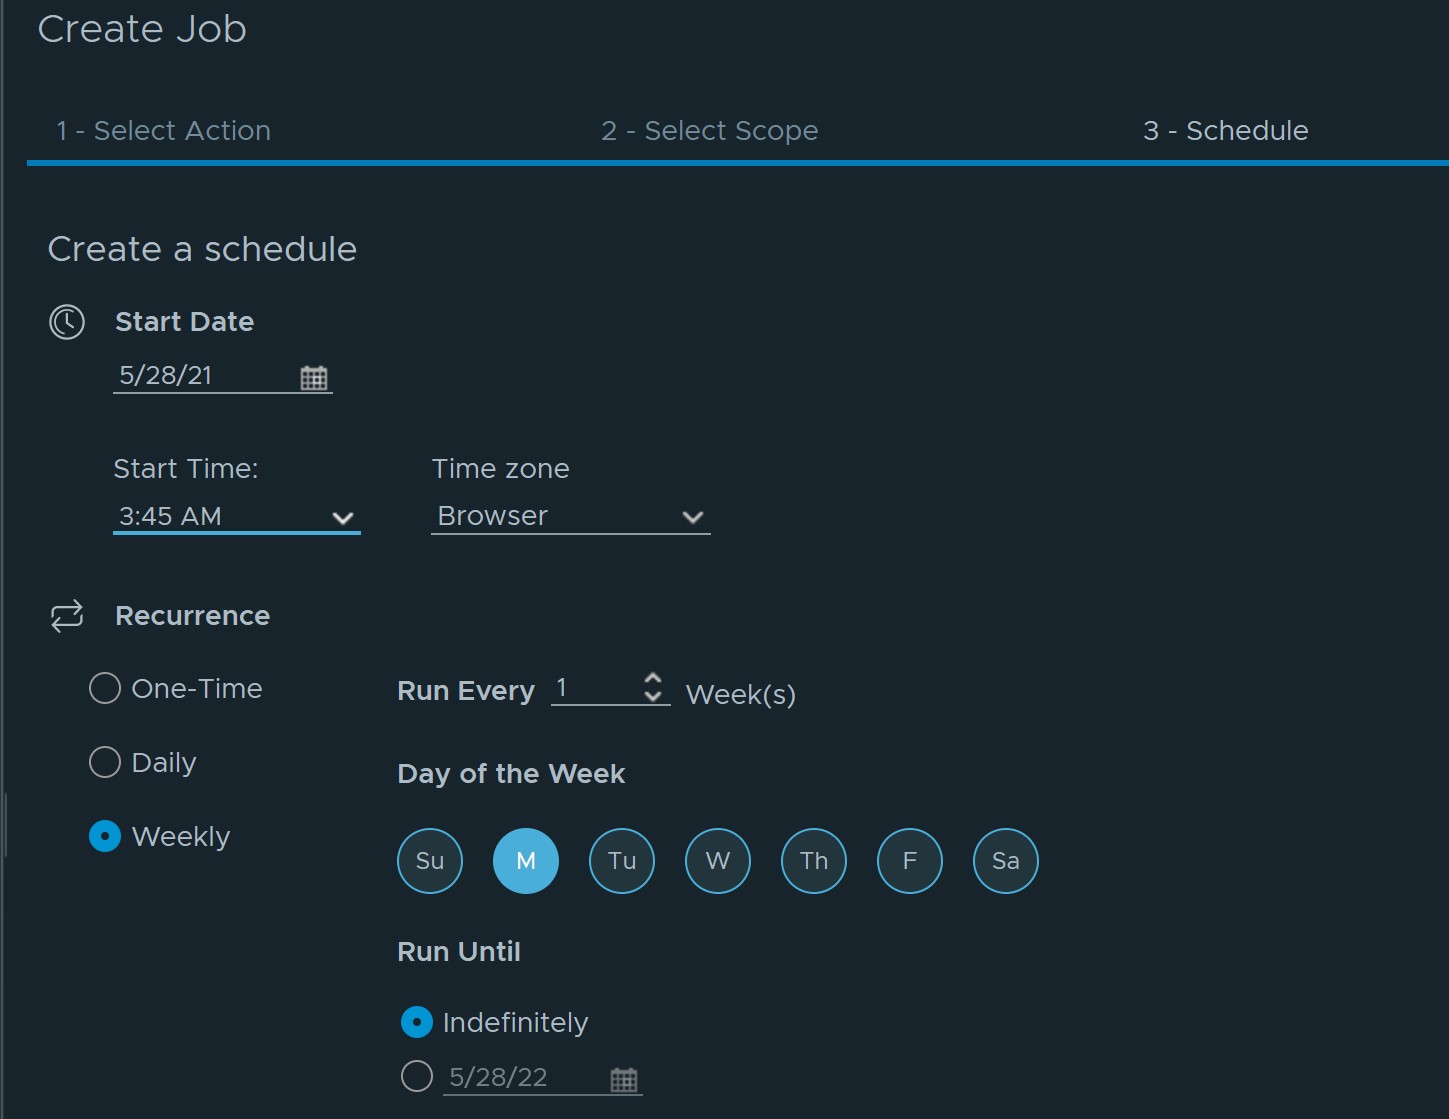
http://www.vmignite.com/2021/05/vrops-8-4-how-to-use-automation-central-to-schedule-task/
Do you know of an existing property that will show licensing for ESX (ROBO, CPU)/vCenter/etc.? I can’t find the property anywhere that would allow me to build this type of dashboard or report.
You can view what is being licensed under Administration > Licensing > License Group. Highlight a group and click on Members. There is no current way to export this list as I know of.