Download – Vmware Inventory Dashboard for vROPS 7+
Has your manager ever ask how much capacity is being used in a particular vCenter or your entire environment? This dashboard is now upgraded to include all this information and more. The dashboard shows complete inventory of your environment (vCenter, Hosts, Clustes, VMs, etc), how much capacity you have in total, how much you are actually using, and how much is configured. It breaks down in greater details of what those Hosts, VMs, Clusters, etc are. It also shows you the latest Host, VMs, Clusters, etc that were added to the environment.
Download for vROPs 7.0 and above only!
Download here https://code.vmware.com/samples?id=5629#
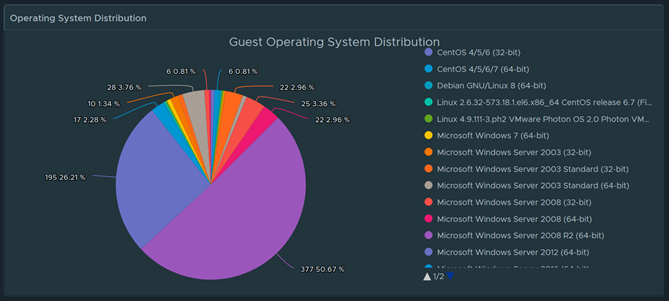
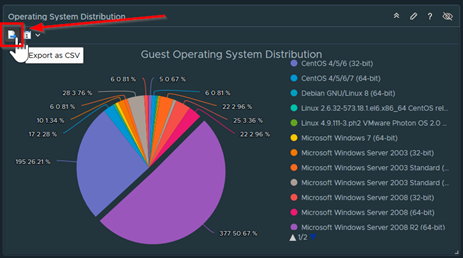
Nice pie chart that provides great insight of how your Operating Systems are being distributed in your environment. In this example I can see 50% is running Windows Server 2008 R2 64bit. Coming in second is Windows Server 2012 64-bit
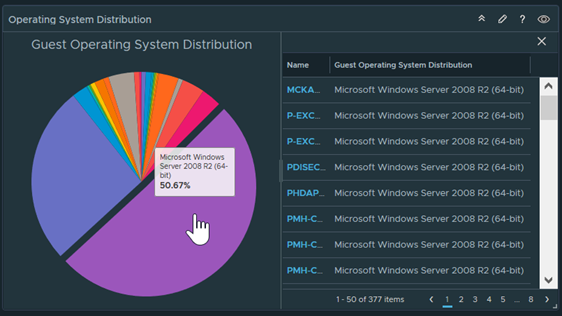
I can click on any part of the Pie chart and it will instantly display which VMs are they
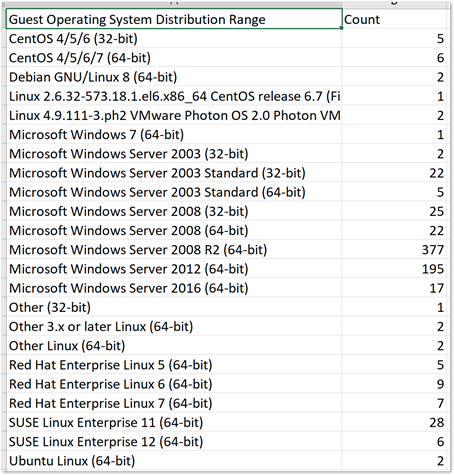
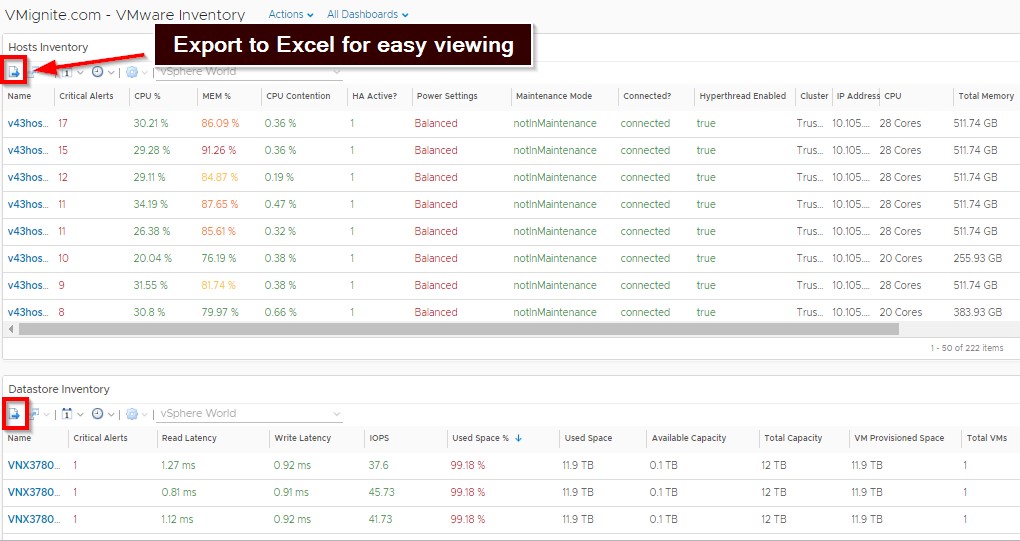
Click on the Export Icon and I can export a breakdown in Excel form
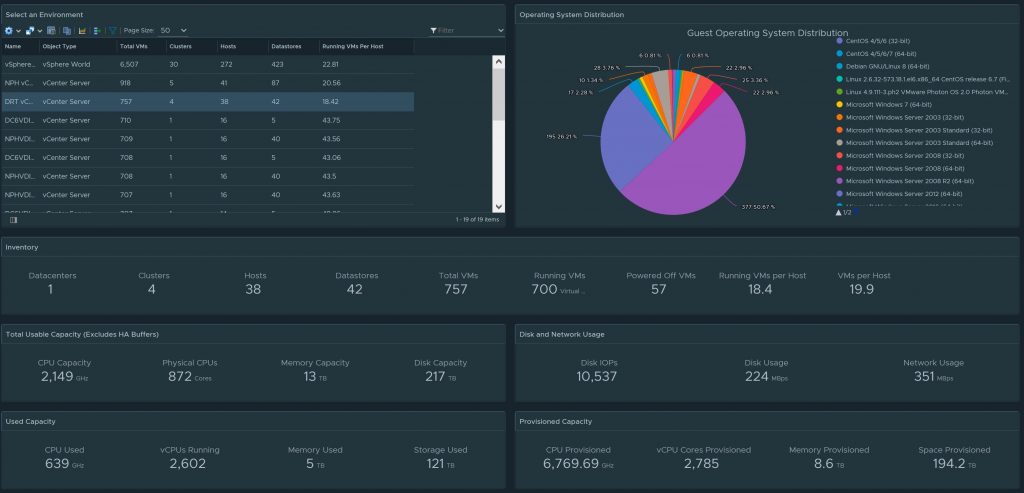
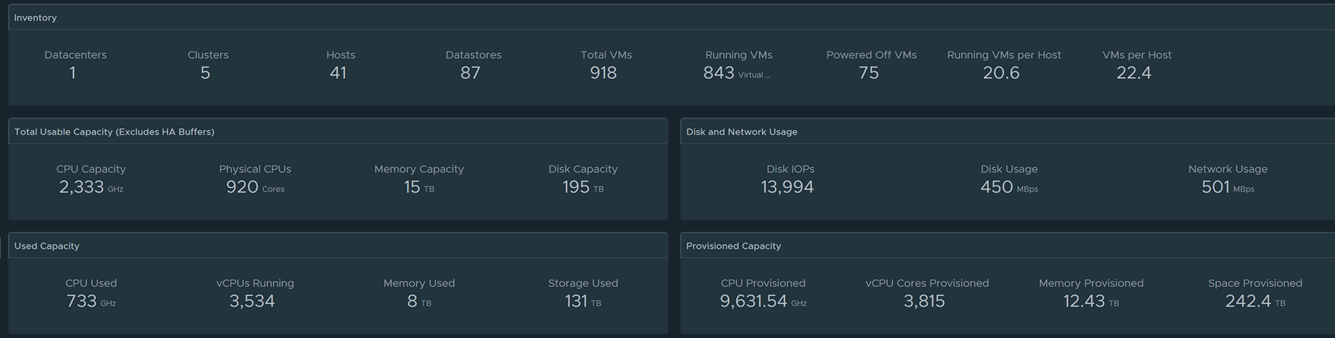
Next section shows me the entire inventory, how much total capacity do I have, how much capacity am I using, and how much is configured. Notice I even included Network Usage and IOPs
All Performance Metrics are color coded and each can be sorted
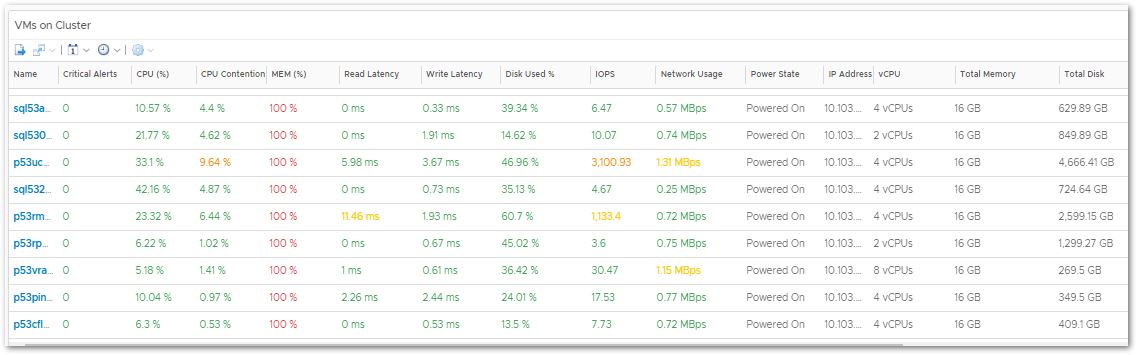
Click on the Export button to export to Excel
Scroll to the bottom to see Total and Averages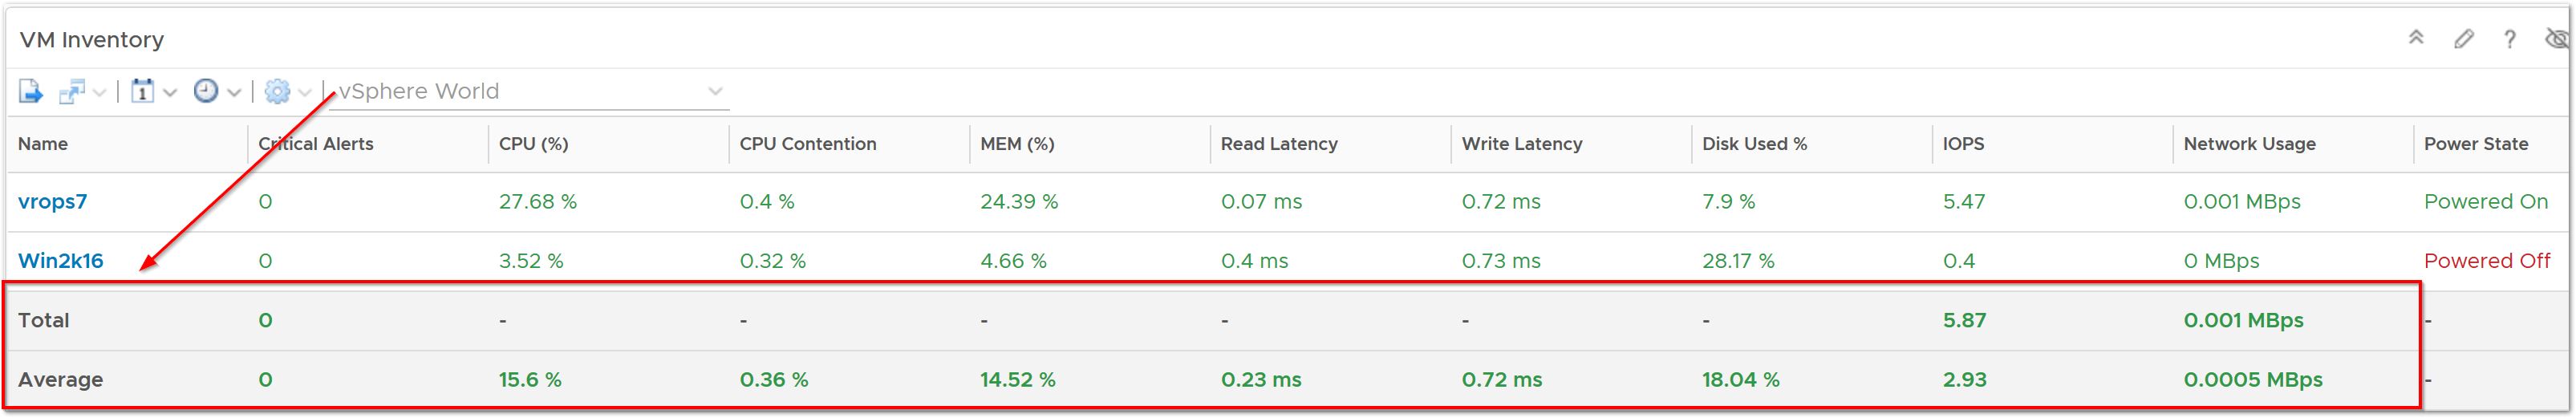
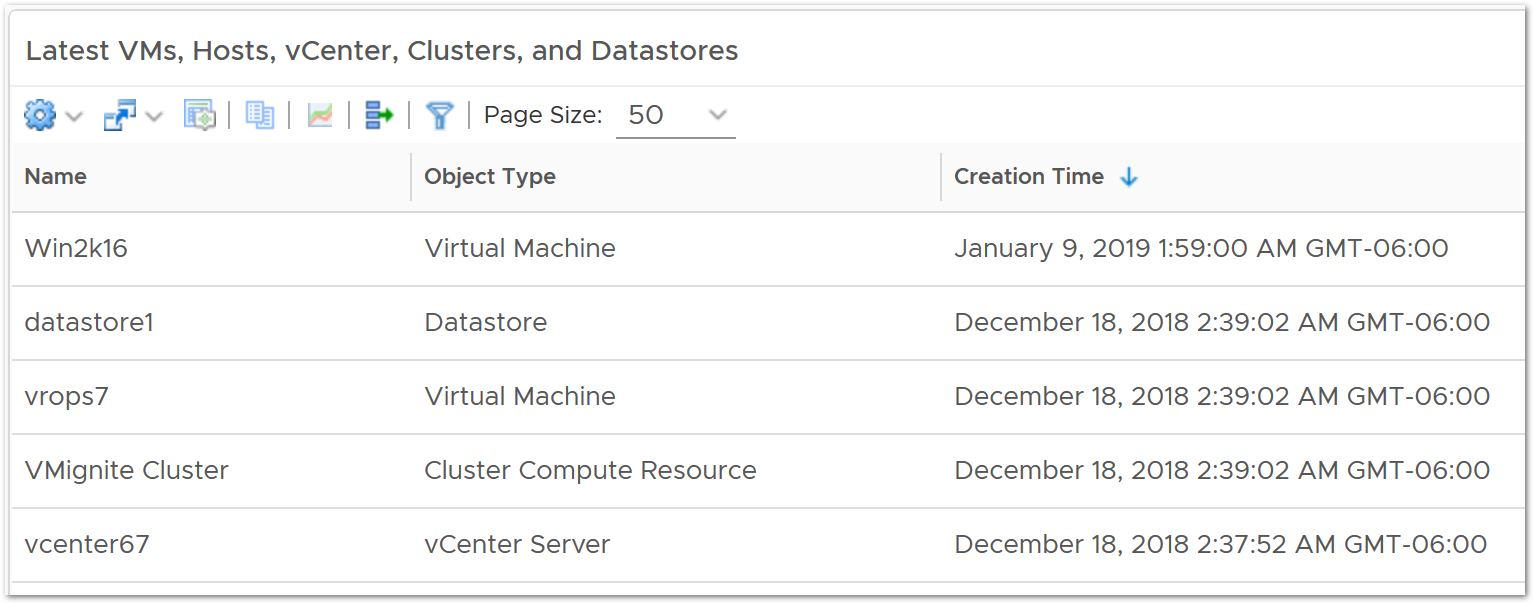
View the latest VMs, Datastores, Hosts, and vCenters collected
To import in version 7.0 and above
-
First unzip the file you just downloaded, it will contain a dashboard and a view file
-
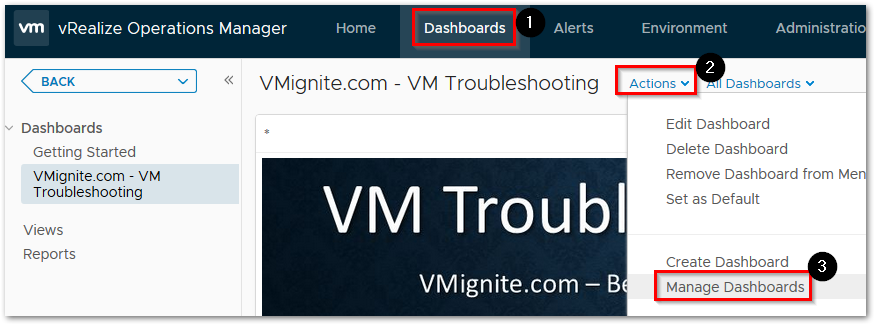
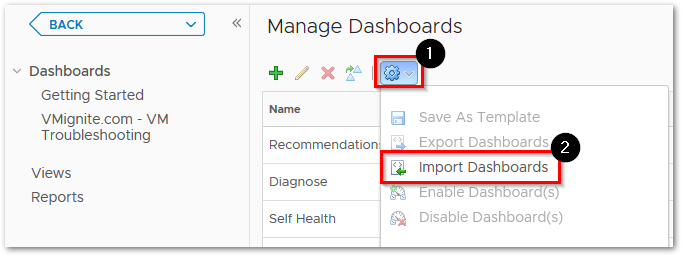
Go to Dashboards > Actions > Manage Dashboards
-
Hit the dropdown and select Import Dashboards. Import the Dashboard.zip file
-
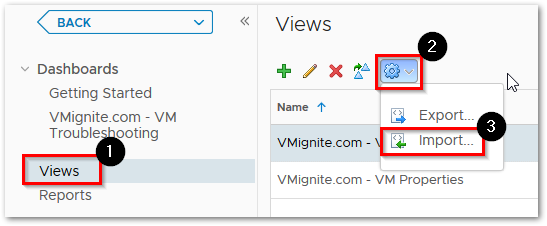
Next to go Views > Dropdown > Import. Import the View.zip file