The purpose of this dashboard is to capture all the important issues with Physical Host Hardware, host network availability, storage availability, and vSwitch configuration issues. Out of the box, vROPS captures all these issues using alerts definitions. This dashboard filters these alerts and turn the data into something a lot more useful and way easier to manage. A guide on how I created this dashboard can be found here. Below is a guide on how to best use this dashboard
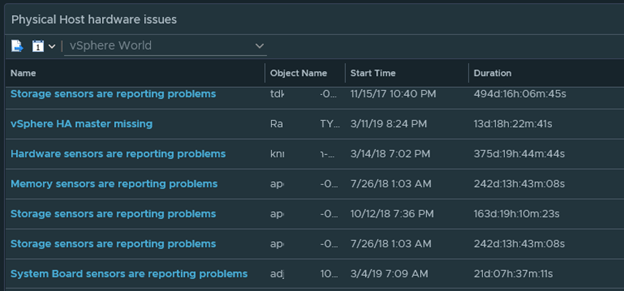
All physical host hardware issues are detected here. View memory, hardware, fan, temperature, voltage, system board issues, and more. Shows when it started and how long it has been happening.
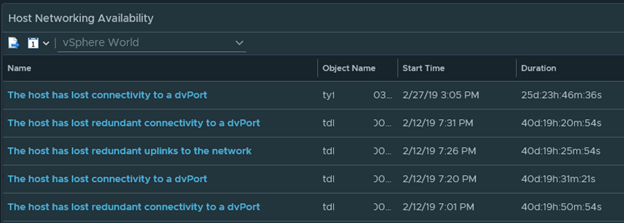
Is the redundant networks on your host working properly? Are the Host networks on the host configured correctly? This part of the dashboards shows it all.
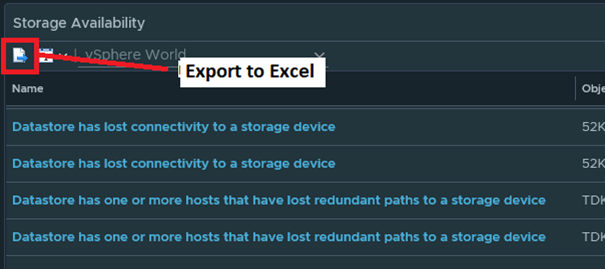
Storage configured correctly? I wouldn’t wait till an outage to find out.
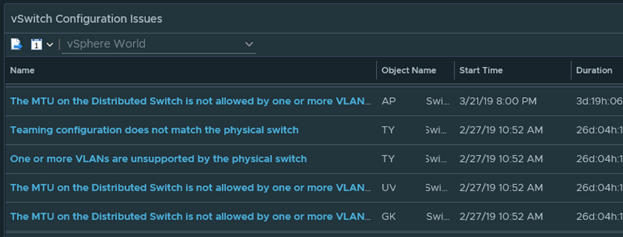
This part of the dashboards checks if all your MTU and VLANs are configured correctly
Download the dashboard here >>>> Hardware Alerts Issues (2873 downloads )
You may also want to check out these other dashboards these other related dashboards uploaded by my coworker Joe Tietz.
- Infrastructure Issues
https://code.vmware.com/samples/4885/infrastructure-issues-dashboard?h=joe%20tietz - VM issues
https://code.vmware.com/samples/4902/virtual-machine-issues—cup-of-coffee-dashboard?h=joe%20tietz
To import in version 7.0 and above
-
First unzip the file you just downloaded, it will contain a dashboard and a view file
-
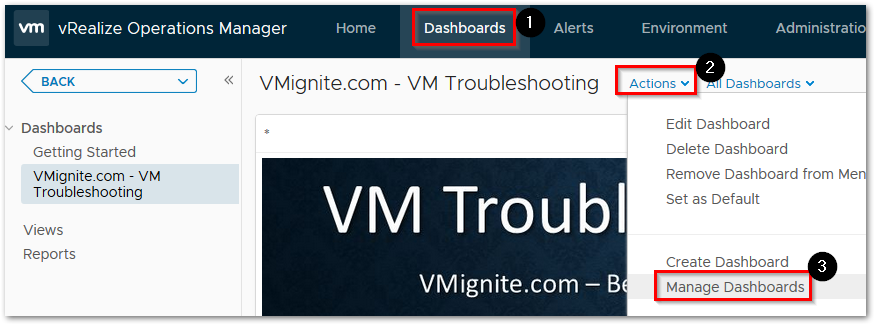
Go to Dashboards > Actions > Manage Dashboards
-
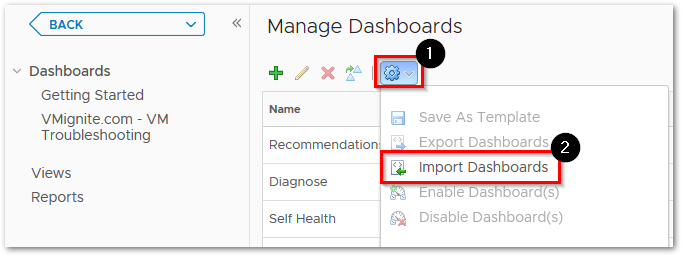
Hit the dropdown and select Import Dashboards. Import the Dashboard.zip file
-
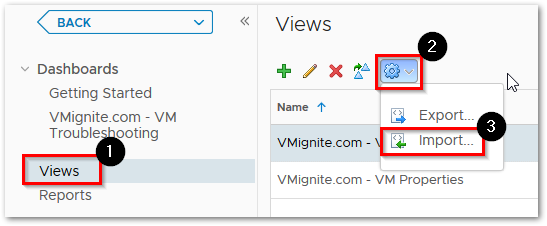
Next to go Views > Dropdown > Import. Import the View.zip file