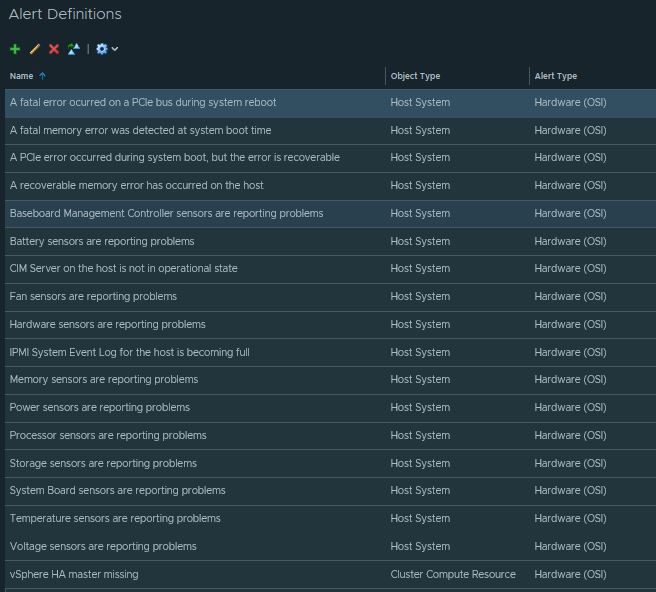
Out of the box, vROPS does an amazing job collecting Physical Host alerts. By default vROPS collects host fan sensor issues, battery sensor problems, voltage issues, system board issues, memory errors, hardware sensor issues, and more. The entire list is shown below. In this guide we are going to create a single view to detect all these issues in one pane of glass. This will be super useful as most companies are not aware that they are having physical hardware issues until it crashes, bringing down numerous Virtual machines along with it.
-
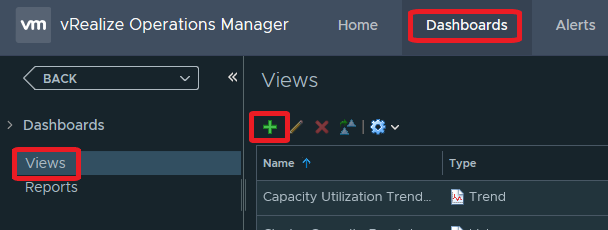
Let’s create a new View by going to Dashboards > Views > + sign
-
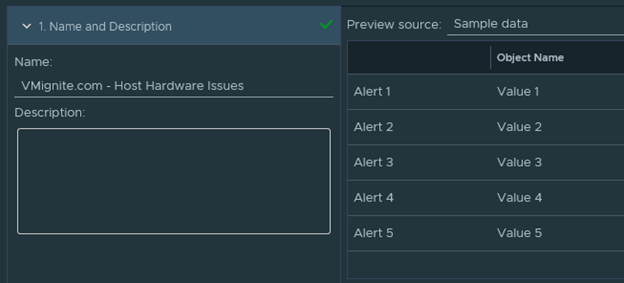
Provide a name for the view
-
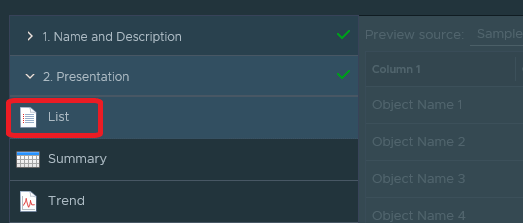
Select the List option under Presentation, since we want to see a list of issues
-
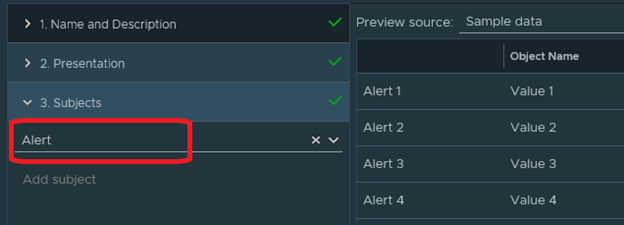
Select Alert as our Subjects. This is only works by using an Alert as you will see later we will filter it out for any Hardware OSI specific issues
-
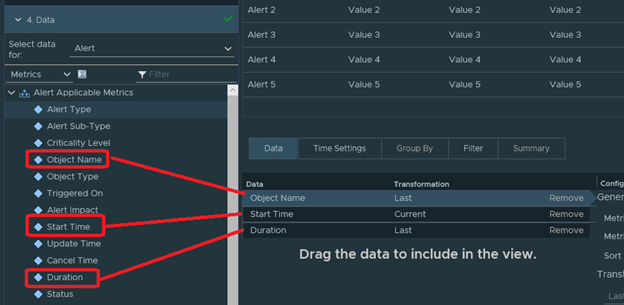
Expand Alert Applicable Metrics and Double click on the following metrics Object Name, Start Time, and Duration. We could always add more metrics if we wanted, but in this case I would like to keep it as simple and clean as possible.
-
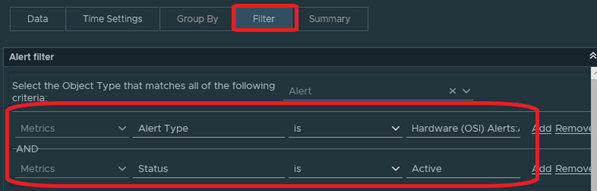
Next we need to filter the alerts out to exactly they way we want, just Hardware issues. Click on the Filter tab and filter the following.
- Metric: Alert Type is Hardware (OSI) Alerts (This filters out to only hardware alerts)
- Click on the Add button to the right of the first filter then filter the next one below
- Metric: Status is Active (This ensures that it displays only active alerts)
-
Click on Save. Now we can see all hardware related issues in our environment.
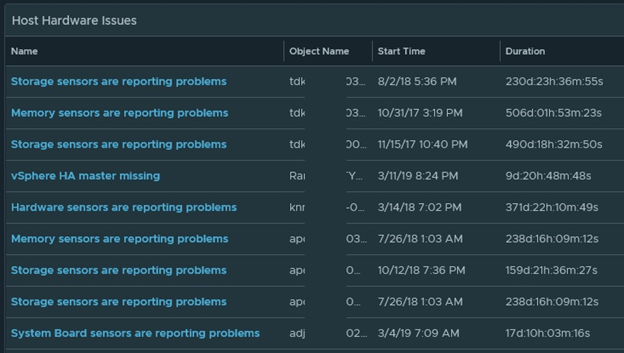
- This is now ready to be added to a dashboard or a report. In my next post I will have a dashboard where you can download that will have Host hardware alerts, Host Networking Alerts, and Storage Alerts.