Category: Log Insight

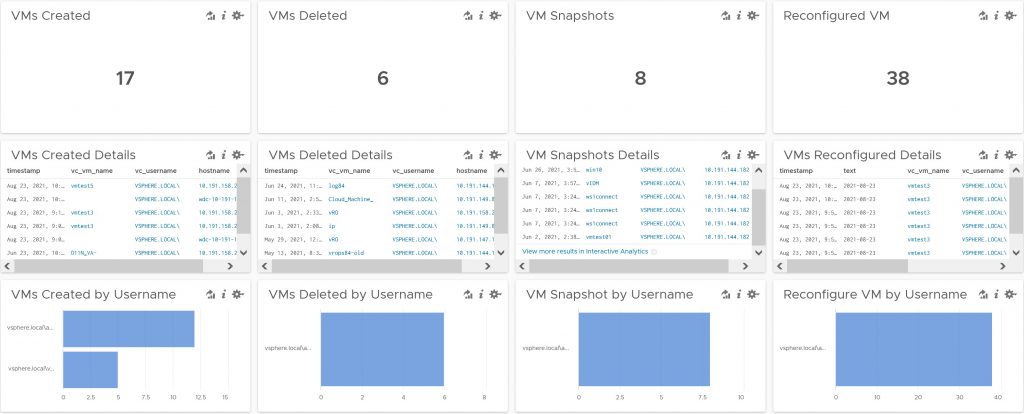
Log Insight – VM Monitoring Dashboard (Download)

This is a must-have dashboard for anyone who wants to know who did what with my Virtual Machines. With this dashboard alone you will be able to know who created, deleted, modified, updated, power cycled, moved, remoted in, and exported a VM. It’s a 360 audit monitoring dashboard for everything Virtual Machines related. Details below.

What you will be able to monitor

  • VMs Created/Deleted
  • VMs Powered On/Off
  • VMs Rebooted
  • VMs Configured (Disk, Network, CPU, Memory)
  • VMs Renamed
  • VMs that got vMotioned
  • VMs that need Disk consolidation
  • Reservations
  • Limits
  • Snapshots
  • VMs Exported
  • VM Configuration Parameters changes
  • ISO Mount
  • VMs moved to folders
  • VM made to a template
  • Remote Consoled used to access a VM
  • VM Hot Add Modifications (CPU/Memory)
  • VM Versions updated
  • VMs Customized
  • VM HA event

Download Here: https://code.vmware.com/samples?id=7667

Install Guide

To import go to Content Packs > Import Dashboard. Import as Content Pack. Go to Dashboards to view the dashboard.

twitterpinterestlinkedinmail


Log Insight – How to Monitor a specific application Log File

The following instructions will show you how to log and monitor any custom windows application as long as you know the directory of where the logs are stored.

Use Case Scenario: My web application crashes every time Error 5015 occurs on my application. I would like to be able to log and get alerted each and every time this happens. This will allow me to fix it before anyone knows that the server is down.

  1. In this example we will show you how to find the error called Error 5015 that is located in a C:\Log directory in a text file called log_file.txt. This is a simulation of a custom application error message.
    log
  2. First make sure you have the Windows Agent installed. Go to Content Pack > Marketplace and make sure the Microsoft – Windows Content Pack is installed. If it is not installed, then make sure you install it.
  3. Next we need to configure the Windows Agent to look for this specific path and application log file. Go to Administration > Agents and from the dropdown select Microsoft – Windows

  4. Scroll to the bottom and click on Copy Template

  5. Provide a name and then click on Copy

  6. Add a filter to apply this to a specific Host or IP address. In this example we will apply it to all Windows Operating System. Also remember to Enable auto-update

  7. Next we will need to tell the agent to find the specific application log file. Highlight File Logs and click on +New

  8. Enter a name and click on OK

  9. Enter the directory that the application log location and then enter the file name to include

  10. If you click on Edit you can see how it looks like in the configuration file

  11. Once completed, click on Save Agent Group located on the bottom of the page

  12. Now click on Download Log Insight Agent and install the agent on the Window server you want to monitor

  13. If everything is done correctly you should now see your server listed when your custom agent from the dropdown is selected.

  14. If you click on the Hostname it will bring you to logs page for that specific Virtual Machine

  15. Now enter in the specific Error message to see if it occurred. Note, if you just installed the agent, it will not catch any past events that happened before the installation of the agent. In my example you can see my Error 5515 example did occur in the last 5 minutes and notice how I also see the filepath field.

  16. To add this alert to my dashboard, click on the icon

  17. To create an alert, click on the icon

twitterpinterestlinkedinmail


vROPs 6.5 – How to integrate Log Insight with vROPS

New in vRealize Operation Manager 6.5 is the built-in integration with vRealize Log Insight. This becomes very useful as you no longer have to hop around to two different applications. You can now access Log Insight dashboards, content packs, and detailed logs directly from vROPs itself. The setup is quite straightforward but this guide is written for those who may have confusion on the setup itself.

  1. Log in to vROPs and go to Administration > Solutions > VMware vRealize Log Insight >
  2. Add a display name and Log Insight server and click on Test Connection and then Save Settings. This configures vROPS to be able to open Log Insight from vROPS.
  3. Next we will need to log into Log Insight and configure the connection to vROPs.
  1. Go to Administration > vRealize Operations and fill in the information for vROPs and then click on Test Connection and then Save. This allows Log Insight to communicate with vROPS.
  2. Now go back to vROPS and either click on the Log Insight Tab or the Log Insight icon on the left hand side to open Log Insight from vROPS.
  3. To view Log Insight logs inside vROPS for a particular Virtual Machine just search for your VM and select it.
  4. Once selected click on Logs to view it in Log Insight. Make sure you have the Log Insight agent already installed for that Virtual Machine
twitterpinterestlinkedinmail


Log Insight 4.0 – How to manually backup and restore settings

The following guide will show you how to manually backup all the advance configurations in Log Insight (e.g. IPs, DNS, Forwarding Rules, NTP) and custom work done such as Agent Groups, Dashboards, Alerts, etc. For full appliance backups, third party backup tools should still be used. Special thanks to VMware coworkers Steve Flanders, Yogita Patil, and Alan Castonguay for the advice when putting this together. The following guide will backup Log Insight 3.0 and above.

Backup Best Practices

  • Setup scheduled backups (first one should be full backup)
  • Replication is also recommended
  • When using snapshots, Log Insight does not support quiesced snapshots
  • Making changes to the configuration files directly from the appliance console is not officially supported beginning in vRealize Log Insight 3.0. You will need to use the built-in UI (see steps below).

How to manually Backup Log Insight Advanced Configurations

  1. Open a browser and authenticate to the Log Insight cluster virtual IP (VIP) or master node
  2. Check the box Show all settings and then select all and copy everything in the Server Settings Configuration box
  3. Open Notepad and paste everything into Notepad. Save the settings.
  4. In a clustered environment, all the settings copied from the UI is identical and is replicated between all nodes therefore you will only need to make only one backup copy per a Log Insight cluster. You will only need to repeat these steps only if you have multiple Log Insight clusters.

How to Restore Advance Configuration Settings

If it recommended to have a clean snapshot and a full backup before you do the following steps. Also a restart may be required after restoring settings.

  1. Open the saved Notepad file and Copy everything
  2. Log in to https://LogInsight_Hostname_Or_IpAddress/internal/config and login with the admin credentials
  3. Check the box Show all settings and then select all and paste
    and replace everything in the Server Settings Configuration box
  4. Change any settings if needed (optional if you want to change IP address or FQDN for example). Then click on Save
  5. If a restart is required. Just click on Cluster > Select Node you want to restart > Restart Node. Wait 2 minutes for each node to complete restart and run startup checks before proceeding with the next node
  6. Note: If you are copying these settings to a new cluster, the new cluster probably won’t have the keys to decrypt them. You can use the normal UI (or API) to manually set the password for Active Directory and SMTP binding.

How to backup custom dashboards, alerts, queries, agent groups

The following guide will show you how to backup custom work that you have created. Each user will have to backup their My Content manually or they can choose to share their dashboard out and have it backed during the process of backing up all shared dashboards. Also new in Log Insight 3.6 and above is the ability to impersonate another user. This must be enabled in administration > General > Enable User Impersonation. This will allow a Super Admin to be able to impersonate any user. All logs will be stored in in ui_runtime.log. For more information on this you can read more about it http://sflanders.net/2016/11/07/log-insight-3-6-user-impersonation/

  1. Login to Log Insight with an account with full admin rights
  2. Go to > Content Packs > My Content
  3. Hit the dropdown next to My Content and select Export
  4. Select the Dashboards, Queries, Alerts, Extracted Fields, Agent Groups that you want to export then fill out the information on the right side and click on Export when you are done.
  5. Click on OK to save the file

  6. Now click on Shared Content and repeat the process above to export Shared Content

How to restore custom dashboards, alerts, queries, agent groups

  1. Go to > Content Packs > My Content
  2. On the bottom left click on Import Content Pack
  3. Select the backup file and click on Open
  4. Select either import as Content Pack or into My Content (allows you to edit) and then click on Import when done
  5. Repeat the steps as needed for any other backups you have
twitterpinterestlinkedinmail


Log Insight 4.0 – How to create and configure a Gauge Chart

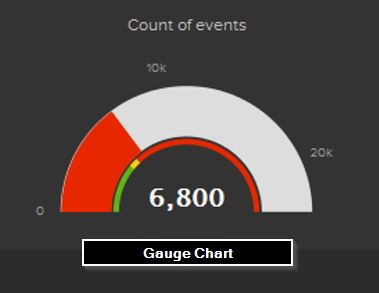
One of the latest features of Log Insight 4.0 is the ability to create a Gauge chart that can turn green, yellow, and red based on a static number you set. The following guide will show you how to create a gauge chart based on a search criteria of “Error” found.

  1. Login to Log Insight and click on Interactive Analytics


  2. In the search bar, type in “error” and hit enter


  3. Hit the second dropdown to the top left and select Non-time series and click on Apply


  4. Notice how it now displays a total number


  5. To change it to a Gauge chart we will have to switch the Chart Type from Automatic to Gauge


  6. Notice how the chart now changes


  7. Now I want to set anything above 6000 events to show red instead of green. Hit the Gauge dropdown and add red as a value of 6000 as shown. Notice how the chart now changes red because the threshold of 6000 and above has been met.


  8. To add it to a dashboard, click on the icon


  9. Fill in a display name and make sure Widget Type is set to Chart


  10. You can now view it on your dashboard

twitterpinterestlinkedinmail


Log Insight – How to upgrade Log Insight

The following guide will show you how to upgrade Log Insight. It is recommended to have a full backup for Log Insight and create a snapshot before upgrading.

  1. Log into http://vmware.com and download the Log Insight Upgrade Package

  2. Once downloaded login to your Log Insight server and click on Administration (top right corner)


  3. Click on Cluster on the left side menu and then click on Upgrade Cluster


  4. Browse for the upgrade PAK we downloaded earlier and click on Open


  5. Click on Upgrade


  6. Once it is completed you should see the following. Click on OK


  7. You should now the version has changed

twitterpinterestlinkedinmail


Log Insight 3.6 – How to configure a 3-node cluster with integrated load balancer

The following guide will show you how to configure a Log Insight cluster with Log Insight’s integrated Load Balancer. Some of the benefits of a Log Insight cluster using the internal load balancer includes the following:

  • Ingestion HA – where you could lose any node in a cluster and ingestion would continue to function
  • Query HA – allows any node to be lost (including the master) and features such as users alerts and queries would continue to function
  • The Internal load balancer will automatically balance ingestion and queries across nodes which will provide better performance
  • Scaling benefits – Log Insight 3.6 now scales up to 12 nodes per Log Insight cluster and allows up to 4TB of live searchable data under management per node

Pre-Requisites for Log Insight Cluster

  • One fixed IP address must be allocated per vRealize Log Insight appliance.
  • A DNS A Record and matching Reverse (PTR) should be created per appliance.
  • Minimum of three nodes in a vRealize Log Insight cluster
    • Two-node clusters are not supported because failover will fail in this situation
  • All vRealize Log Insight nodes must belong to the same vCenter Cluster
  • All vRealize Log Insight nodes and the load balancer IP (VIP) must belong to the same L2 network
  • All vRealize Log Insight nodes must have the same exact Log Insight appliance virtual machine configurations (CPU, Memory, Disk)
  • All vRealize Log Insight nodes (master and worker) must have the same SSL certificate
  • Time must be synchronized between all nodes using an NTP server

In my lab I have built 3 separate Log Insight instances. I have entered the following into DNS and will be using the following NTP server in my lab:

Function IP Address FQDN NTP
VIP 192.168.100.40 log.lancorp.com N/A
Log Insight Master 192.168.100.41 log-001.lancorp.com 192.168.100.51
Log Insight Worker 192.168.100.42 log-002.lancorp.com 192.168.100.51
Log Insight Worker 192.168.100.43 log-003.lancorp.com 192.168.100.51


Configuring Log Insight Master Node

  1. Type your Log Insight FQDN in an internet browser and click on Start New Deployment

  2. Create a password and click on Save and Continue

  3. Enter a license key and click on Save and Continue

  4. Click on Save and Continue
  5. Add NTP servers and click on Save and Continue
  6. Click on Finish


Configuring vSphere Integration

After configuring the master server we will get prompted to integrate vSphere, Agents, and Syslog to our Log Insight instance. The following steps will walk you through integrating vCenter server.

  1. Click on Configure vSphere integration

  2. This will lead you to the Administration > vSphere page where you can enter your vCenter Server information. Make sure to test your connection and then click on Save
  3. Click on Cluster on the left menu and verify that you only see one node. As you can see we only have one node. In the next few steps we will be adding two more nodes and then we will go back here again to view the new changes.

Adding the Worker Nodes

Now that the master server is installed we will need to add two more worker nodes to complete a minimal cluster. Note: we can scale up to 12 nodes, however in my lab I will only be doing the minimal of a 3-node cluster.

    1. Open an internet browser and enter the FQDN of your worker node. When the wizard pops up select Join Existing Deployment
    2. Enter the FQDN of your Master Node and click on Go

    3. Click on Click here to access the Cluster Management page

    4. Click on Allow
    5. Notice that the warning says 2-nodes are not supported because Log Insight High Availability will not work with just two nodes

    6. Repeat the steps above again to add the 3rd Node

    7.  

    8. Once the third node is added go to the Administration > Cluster view again and verify that you have 3 nodes and everything says Connected
    9. Configuring Log Insight Integrated Load Balancer

      Now that we have our 3-node cluster we will need to configure Log Insight’s integrated Load Balancer to point to the VIP we pre-created.

        1. Click on New Virtual IP Address

        2. Fill in the IP address and the FQDN of the VIP and click on Save

      1. The Integrated Load Balancer should now be configured

      2. We can now login to Log Insight using the FQDN of the VIP
      twitterpinterestlinkedinmail


Log Insight – How to Monitor any Windows Service

Monitor critical services such as Exchange, SQL, Sharepoint, and more. The following guide will show you how to use Log Insight to monitor any Window Service and even get email alerts sent to you.

  1. Login to Log Insight as Admin

  2. On the top right corner, hit the dropdown and select Content Packs

  3. Verify that the Microsoft – Windows content pack is installed. If not install it
  4. Click on Microsoft – Windows > Agent Groups and copy everything in the Configuration box
  5. Next go to the menu on the top right corner and select Administration

  6. Click on Agents and paste everything to the Agent configuration box. Click on Save Configuration and then download the agent.

    Note: The configuration must be entered else the Windows Service won’t get detected

  7. Install the agent on the Windows machine that we want to monitor
  8. Next we need to find the Service name we want to monitor by going to Control Panel > Administrative Tools > Services
  9. Double click on the service we want to monitor and copy the display name and then close out the window.

    Note: In this example I chose the Print Spooler service, however the following steps applies to any Window Service. All you need is the Display Name of the service.

  10. Now go back to Log Insight and click on Interactive Analytics
  11. The following search Query applies to any Window Service. All we need to do is replace <Service Display Name> below with Print Spooler and enter it in the search query.

    The <Service Display Name> service entered the stopped state


  12. Next we can add it to a dashboard by click on the icon
  13. Fill out a name and assign it to a Dashboard and then click on Add
  14. Now go to Dashboards and click on the dropdown and select My Dashboards. You should now see the search query. It will display results only if a printer spooler service goes down.
  15. Now if we wanted an email alert we would repeat steps 10 to 11 and select
    > Create Alert from Query

  16. Provide a Name and Email address and click on Save
  17. You will now get an email alert whenever the Printer Spooler goes down
twitterpinterestlinkedinmail