Category: Maximize IT

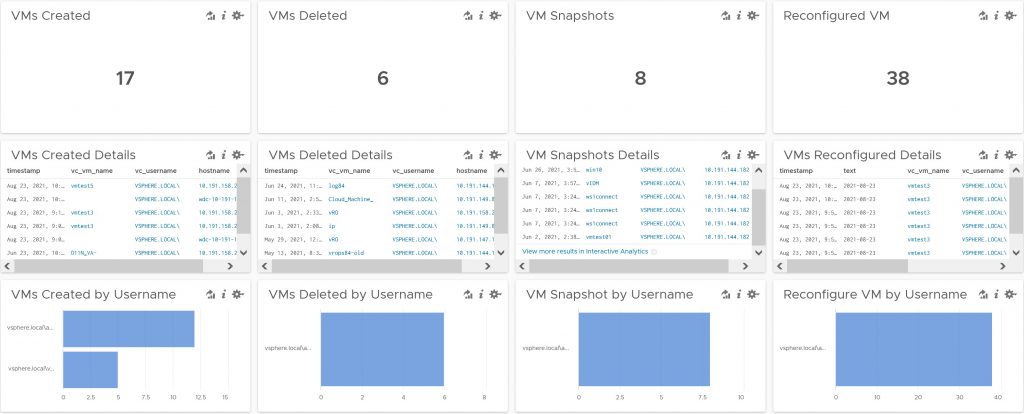
Log Insight – VM Monitoring Dashboard (Download)

This is a must-have dashboard for anyone who wants to know who did what with my Virtual Machines. With this dashboard alone you will be able to know who created, deleted, modified, updated, power cycled, moved, remoted in, and exported a VM. It’s a 360 audit monitoring dashboard for everything Virtual Machines related. Details below.

What you will be able to monitor

  • VMs Created/Deleted
  • VMs Powered On/Off
  • VMs Rebooted
  • VMs Configured (Disk, Network, CPU, Memory)
  • VMs Renamed
  • VMs that got vMotioned
  • VMs that need Disk consolidation
  • Reservations
  • Limits
  • Snapshots
  • VMs Exported
  • VM Configuration Parameters changes
  • ISO Mount
  • VMs moved to folders
  • VM made to a template
  • Remote Consoled used to access a VM
  • VM Hot Add Modifications (CPU/Memory)
  • VM Versions updated
  • VMs Customized
  • VM HA event

Download Here: https://code.vmware.com/samples?id=7667

Install Guide

To import go to Content Packs > Import Dashboard. Import as Content Pack. Go to Dashboards to view the dashboard.

twitterpinterestlinkedinmail


vROPS 8.4+ – Executive Dashboard (Download)

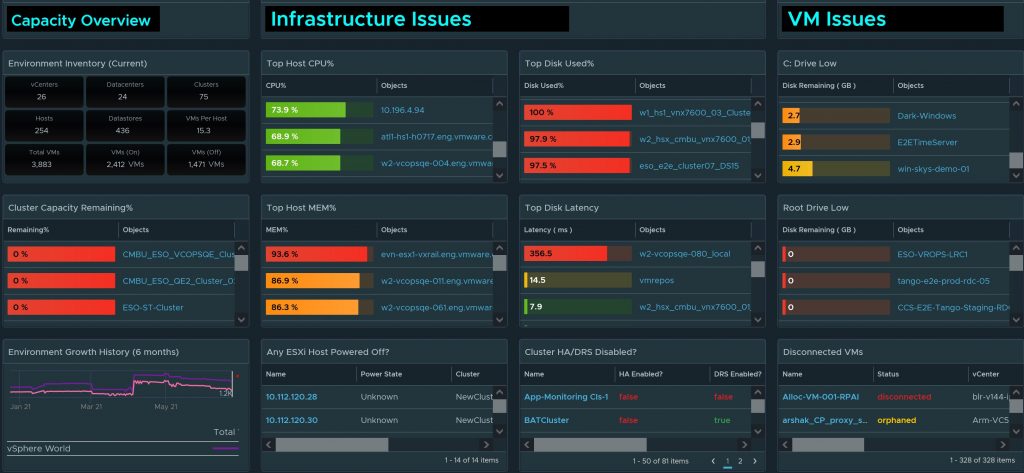
With the new features of 8.4, I was finally able to finish my Executive Dashboard the way I envisioned it. In one pane of glass, executives will be able to see how much capacity do they have left, what is my current inventory, how fast am I growing, does my current infrastructure have any cpu and/or memory bottlenecks, is my storage good in space and running at optimal speed, do I have any ESXi host down, is Cluster HA/DRS enabled, and does my VMs have enough resources to prevent any major outages. Read the user guide below to fully understand how to use the dashboard.  This dashboard could also be a 24/7 critical monitoring dashboard as well.  This dashboard should work with older versions as well, just won’t look as nice.

Download the Dashboard here: https://code.vmware.com/samples?id=7628

What the dashboard covers

Capacity

  1. Inventory
    1. vCenters, Host, Clusters
    2. Datastores
    3. VMs (Powered On, Powered Off, VM to host ratio)
  2. Cluster Capacity Remaining
  3. Capacity Growth in the past 6 months

Infrastructure Health

  1. Host high in CPU usage %
  2. Host high in Memory usage %
  3. Host that are down or powered off
  4. Datastores out of space
  5. Datastores with disk latency
  6. Clusters with HA/DRS turned Off

VM Health

  1. C: Drive low space
  2. Root Drive low space
  3. Disconnected VMs

Note:

  1. The entire dashboard auto refreshes every 5 minutes, so you always have the latest updates.  Therefore could also be used as a NOC dashboard
  2. You must be on vROPs 8.4 to have the best experience.  This dashboard should work with older versions as well, just won’t look as nice.
  3. You will need to enable these metrics to see C: Drive space low and Root drive space low.

    http://www.vmignite.com/2021/02/vrops-8-how-to-enable-hidden-metrics-and-properties/

  4. To remove any cluster, host, environments you don’t want to see in any of the widgets, just edit the widget and filter it out.
  5. Click on the expand button on any widget to see more values and to maximize the window

User Guide

View what you have in your entire environment

Capacity Remaining % is calculated by the lowest remaining value for CPU/Memory/Disk remaining. By default, it will use actual usage% for CPU/Memory/Disk. If you like you can adjust it to allocation model in the policies. You can also add a buffer as well to CPU/Memory/Disk. I set the thresholds for 20% for yellow, 15% for orange, and 10% for Red. This should all be green.

Measures VM growth in the past 6 months. Hover your mouse over the graph to see exact numbers of VMs at a certain time. Measures Total VMs and Running VMs

Make sure all ESXi Host utilization is green. Anything above 80% is yellow, 85% is amber, and 90% is red. Having high utilization may cause CPU/Memory bottlenecks. And if you reach the max, it may cause outages to VMs.

If the Power State is Unknown, this is bad. It means that the ESXi Host is either disconnected, orphaned, or not responding. This is most of the time not planned therefore you should address this immediately. If the Host is Powered Off, this is usually planned.

Do not let any Datastores be in the red zone. Even when you think it was planned and is under control, I have seen many customers fill up disk space which caused outages to many VMs that are on the same datastore. Thresholds are 85% yellow, 90% Orange, and 95% for red.

Disk latency can degrade performance for VMs on that datastore. Thresholds are 10ms for Yellow, 15ms for Orange, and >20ms for Red.

This widget will catch if one of the following is turned off Cluster HA or Cluster DRS. If this is blank, that means none are found which is a good thing

Having no space on the C: Drive for Windows OS and Root Drive for Linux OS can cause outages and degraded performance. Make sure no VMs get to that point. You should see values here no matter what. If you don’t you must enable the metrics in the policies. http://www.vmignite.com/2021/02/vrops-8-how-to-enable-hidden-metrics-and-properties/

Any VMs shown here should be addressed immediately on why they are not disconnected. If this is blank, that means none are found which is a good thing

Instructions on how to Import Dashboard

To import in version 7.0 and above

  1. First unzip the file you just downloaded, it will contain a dashboard and a view file
  2. Go to Dashboards > Actions > Manage Dashboards

  3. Hit the dropdown and select Import Dashboards. Import the Dashboard.zip file

  4. Next to go Views > Dropdown > Import. Import the View.zip file

  5. If you get any errors during the process, make sure to click overwrite before importing
twitterpinterestlinkedinmail


vROPS – Alerting Do’s and Don’t

In this post, I will answer how I personally handle alerting for my customers. Once you install an enterprise monitoring tool such as vROPS you will see that your environment has hundreds of alerts for Virtual Machines, Hosts, Datastores, etc. I fully understand the frustration when my customers say they get overwhelmed by all these active alerts as they don’t have any clue on where to begin to start fixing them. Management looks at these alerts and says go fix them. Believe it or not, I rarely ever go to the alerting tab at all, after showing my customers my dashboards they stop relying on the alerting tab to fix issues and start using my dashboards instead. Reason being is because my Health-Check Dashboard covers most of all the alerts that matter and more. With that being said, I will answer all the questions that customers have about alerting based on my 9 years experience at Vmware.

First, I need to put a disclaimer. This is based on my own personal experiences and opinions. This is not an official Vmware best practice guide.

In this post I will answer the following:

  • Do’s and Don’t for alerting (Experience sharing)
  • Too many active alerts, how do I begin to fix all of them? Management expects us to fix all theses. (Resolving alerts)
  • How to manage these alerts? (Alert Management)
  • How to best define what alerts get ticketed and what alerts get emailed? (Prioritizing Alerts)
  • What is my recommended strategy for alerting? (Alerting Strategy)

Do’s (based on personal experience)

  • Do create more alerts as needed, and make sure you test all possible scenarios – if you need an alert that is not out of the box, create it yourself. It does take logic and lots of testing.
  • Do use dashboards instead as they make the process much easier – see my healthcheck dashboard to understand why (link below)
  • Do separate your alerts to 3 separate categories (ticketing, email, and dashboard worthy) – I will explain this more in the last section.
  • Do put a suffix in front of any custom alerts you create to help distinguish it from an Out of the box alert
  • Do use policies to disable and modify alerts as needed

Don’t (based on personal experience)

  • Don’t create a lot of vROPS Policies – this is way too hard to manage even for me. If you have more than 2 policies, you are making it more complicated for yourself in my opinion. 90% of my customers only need one. Only time they need a 2nd is if they have a vRA, or VDI environment that needs different alerting, metric thresholds, etc. I been doing this for 9 years and I can tell you reverse engineering multiple policies is not easy even for me and possibly the person who created it.
  • Do not forward all alerts to ticketing or email as they will get filtered!
  • Do not delete any Out of the box alerts, disable them from the policies instead – they will come back once you do an upgrade
  • Do not modify any of the Out of the box alerts – modify the symptoms from the policies or clone the alert and modify the clone. Then disable the original alert from the policy. Reason is your changes will all get lost once you update vROPS as those alerts will be overwritten back to the default.

Too many active alerts, how do I begin to fix them?

A superior monitoring tool like vROPS will have 1000+ alerts out of the box. Having too many canned alerts is a good thing, in fact this is what you paid for. You paid for the vendor to provide you with preconfigured alerts for all the objects you want to monitor (VMs, Host, vCenter, etc). I rather have 1,000 alerts out of the box than have 200 alerts. Reason is because the less alerts you have the more you must create manually. So, this is not a valid complaint.

Now I fully understand Management looks at these alerts and expect you to use it to make everything better and greater than it was before. Easier said than done as you begin to look at all the active alerts and you are confused on where to begin to fix all of these. To best answer your question on how I deal with this. I rarely go to the active alerts section at all. Yes, I been doing this long enough to know what the alerts mean but even I find it hard to start fixing everything by going to this section. Hence why I skip it totally and create a dashboard.

Now why do I use a dashboard instead? First let me explain the goal of all these alerts is to notify you what is wrong with your environment today. A dashboard allows me the best way to organize the data, modify the thresholds, and view it the best way possible. Download my dashboard and you will understand what I mean. Best thing is, it is free to download on my site and it is also the number 1 most downloaded dashboard on Vmware code. You can download it below, make sure to read the user guide.

http://www.vmignite.com/2021/02/vrops-vsphere-health-checker-dashboard-2-0/

Also, you can use the alert widget to enhance any dashboard

How do I manage these alerts?

Now that I answered the question on how to remediate the alerts by choosing which ones you want to address and add it to a dashboard. The next questions would be how do I best manage the alerts (add/remove/modify)? To best answer this I will break this up to 3 parts below.

Do I ever Remove Alerts?

Answer is no, mainly because the alerts definitions created out of the box is my way of asking vROPS what do you see. So therefore, I don’t remove any alerts personally. However, I do have customers who would like to remove some alerts from alerting for very good reasons. Most of the time, the alert doesn’t apply to their specific environment, so they don’t want to see it at all. Do not delete the alert! Go to your active policy and look for your alert and disable it from the policies. Reason why you don’t want to delete the alert is because it will come back once your update vROPS.

What do I do if I want to modify the alert?

If it something simple like modifying the symptom from a threshold of 80% to 90%. You can change that in the policy. Now if you want to add on to the alert, you will need to clone the alert and add the extra symptoms to the new alert. Then you will need to disable the original alert in the policy. Reason being is because once you update vROPS, the default alert will go back to the original state, therefore all the modifications you made will get reset back.

Do I add more alerts?

Answer is yes, some alerts are specific to customers ask. Make sure any custom alerts you put a naming in front of it such as VMignite.com – VM Alert. This way you will know that this is a custom alert and it also makes things easier to filter as all you need to do is type in VMignite in the search and it will show you all the custom alerts you created.

How do I best define what alerts get ticketed and what alerts get emailed?

Out of the 1000+ alerts vROPs has out of the box, a company must gather all their Engineers, Operators, and management to decide what alerts matter. All alerts should be defined into three categories:

  • Dashboard Worthy
    • These alerts should only be shown in vROPS. Some example of these would be VMTools outdated or VM Snapshots. These are worthy to be shown on a dashboard but will be a nightmare if they get ticketed or emailed every time this occurs that’s because they happen daily and often. These lower priority alerts often get sent to ticketing systems and email notifications which leads to filtering of all vROPS alerts sent to a folder. So now when something critical such as vCenter is down alert gets sent, they will not see it in their inbox because it got filtered in a folder. This is one of the biggest mistakes that most of my customers do before I got there.
  • Ticket Worthy
    • These alerts are actionable by Operations and Engineering team. Examples would be Datastore is running out of space, ESXi Host has contention that is affecting all VMs on that host, etc. These tickets are actionable, as someone needs to address these before it becomes a greater problem. However, they are not something you would drop what you are doing to fix it. Which leads us to our next category.
  • Email Notification Worthy
    • These are alerts that you drop everything you do and go fix it immediately. In other words, these are alerts that you would ask to be excused in the middle of a meeting or drop your uneaten lunch to go fix it. Examples of these would be Email server is down, Datastore is 100% full which caused VMs to fail, ESXi Host crashed which brought down production VMs, E-Commerce site is down so customers can’t buy anything from our site, etc. These are events that Engineering should be the first to know and will need to fix it immediately before things sprawl out of control. Lots of time this gets filtered due to Engineering receiving too many non-critical alerts, which caused them to filter everything from vROPS to an email folder. This leads to the worst case scenario where the paying customer are the first to find out their servers are broken and calls to complain, which leads to upper management being furious and questioning why did IT Operations not catch it and why are we the last to know. The answer is simple, you bought the right tool, but you haven’t got the right strategy in place. Happened to you before? Well-read below on how to put the right strategy in place.

How to implement the right strategy (based on personal experience)

  1. Make a list of Alerts that matter for each object (Virtual Machines, vCenter, Host, Datastores, etc). Lost? Just copy and paste my spreadsheet below to an excel. Add and remove as needed. Make sure you tell management you got it from VMignite.com. This at least will get you more credibility as I noticed people don’t like or trust using something one person put together. This list was perfected through many engagements with my Fortune 500 customer which make it more creditable.
  2. Setup multiple meetings to get this list done. Noticed I said multiple, this is a timely process but worth it in the end
    1. It is a team effort! Not one person can make all these decisions. You need Operations, Engineering, and management all 100% involved
    2. Go through each line item one by one and ask the question, is this dashboard worthy? Is this also ticket worthy? Should this alert be sent out by Email notification? Make sure you explain them the clear difference between the three or show them this blog post if you must. You may use your Vmware TAM to coordinate this, as I find it always good to have an outsider to manage the meetings.
    3. One line item could fall in all three categories, for example “vCenter server is down” should be on a dashboard, should get a ticket sent, and an email alert as well.
    4. Fill out which team is responsible to resolve the alert. This will prevent conflict later, as everyone has agreed on who will take ownership of that alert.
  3. Once everything is all filled out, use the spreadsheet to create the forwarding rules/notifications in vROPS.
IaaS vROPS Alerting        
Source Name Dashboard Ticket? Email Team Responsible?
vCenter Server vCenter Service is Down
vCenter Server Certificate for VASA Provider(s) will expire soon
vCenter Server Number of Ips to be pinged exceeds the limit
vCenter Server Duplicate object name found in vCenter
vCenter Server A problem occurred with a vCenter Server component.
vCenter Server Refreshing CA certificates and CRLs for VASA Provider(s) failed
vCenter Server The vCenter Server Storage data collection failed.
vCenter Server VASA Provider(s) disconnected
vCenter Server vCenter HA health is degraded
vCenter Server vCenter data collection is slow
vCenter Server vCenter NTP Status is Down
vCenter Server vCenter Backup Job failed
vCenter Server vCenter License is Overused
Source Name Dashboard Ticket? Email Team Responsible?
Cluster vSphere HA failover resources are insufficient.
Cluster vSphere HA master missing
Cluster Proactive HA provider has reported health degradation on the underlying hosts.
Cluster Cluster has CPU Contention caused by Virtual Machines
Cluster Cluster has high CPU workload
Cluster Cluster has Memory Contention caused by Virtual Machines
Cluster Cluster has high Memory workload
Source Name Dashboard Ticket? Email Team Responsible?
Host System Host has CPU Contention for longer than 24 hours
Host System Host has Memory contention for longer than 24 hours
Host System ESXi host has detected a link status ‘flapping’ on a physical NIC
Host System ESXi host has detected a link status down on a physical NIC.
Host System Path redundancy to storage device degraded
Host System vSphere High Availability (HA) has detected a network-isolated host.
Host System The host has lost connectivity to the physical network
Host System vSphere High Availability (HA) has detected a possible host failure.
Host System The host has lost connectivity to a dvPort
Host System A fatal error occurred on a PCIe bus during system reboot.
Host System A fatal memory error was detected at system boot time.
Host System A PCIe error occurred during system boot, but the error is recoverable.
Host System A recoverable memory error has occurred on the host.
Host System Host has lost connection to vCenter Server
Host System Host is experiencing high number of packets dropped
Host System Uplink redundancy on DVPorts degraded
Host System The host lost connectivity to a Network File System (NFS) server
Host System The host has lost redundant uplinks to the network
Host System vSphere High Availability (HA) has detected a network-partitioned host
Host System The host has lost redundant connectivity to a dvPort
Source Name Dashboard Ticket? Email Team Responsible?
Virtual Machine VM Low in Disk Space
Virtual Machine VM High CPU for over a day
Virtual Machine VM High Memory for over a day
Virtual Machine Virtual machine is experiencing memory compression, ballooning or swapping due to memory limit.
Virtual Machine Virtual machine snapshot longer than 2 days old
Virtual Machine Virtual machine has memory contention due to swap wait and high disk read latency.
Virtual Machine Virtual machine has CPU contention caused by IO wait.
Virtual Machine Virtual machine has memory contention due to memory compression, ballooning or swapping.
Virtual Machine Virtual machine has disk I/O read latency problem.
Virtual Machine Virtual machine has disk I/O write latency problem.
Virtual Machine Virtual machine has disk I/O latency problem caused by snapshots.
Virtual Machine Not enough resources for vSphere HA to start the virtual machine.
Virtual Machine vSphere HA failed to restart a network isolated virtual machine.
Virtual Machine vSphere HA cannot perform a failover operation for the virtual machine
Virtual Machine Virtual machine has CPU contention due to memory page swapping in the host.
Virtual Machine Virtual machine has CPU contention due to multi-vCPU scheduling issues (co-stop) caused by snapshots
Virtual Machine Virtual machine has CPU contention caused by co-stop.
Source Name Dashboard Ticket? Email Team Responsible?
Datastore High Disk Latency for over 1 hour
Datastore Datastore is running out of disk space.
Datastore Datastore has lost connectivity to a storage device.
Datastore Datastore has one or more hosts that have lost redundant paths to a storage device.
Datastore A storage device for a datastore has been detected to be off
twitterpinterestlinkedinmail


vROPS – Vmware Appliance Monitoring Dashboard

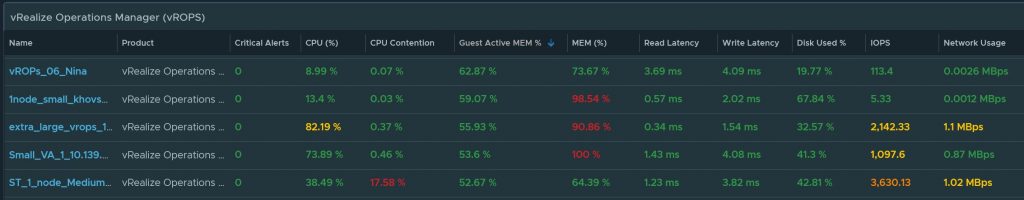
Monitor the performance and configuration of the following appliances: vCenter Servers, NSX, NSX-T, vRA, vROPS, Log Insight, Orchestrator, Life Cycle Manager, Network Insight (vRNI), Vmware SRM, vIDM, Air Watch, and Cloud Proxy appliances. Quickly compare performance stats such as CPU, Memory, Contention, Disk performance, and more. You can also compare configuration stats such as CPU, Memory, IP addresses, VM Tool versions, VM version, and more.

Download here: https://code.vmware.com/samples?id=7599

Monitors the following products

  • vCenter Server Appliance
  • NSX, NSX-T
  • vRA
  • vROPS
  • Log Insight
  • Orchestrator
  • Life Cycle Manager
  • Network Insight (vRNI)
  • Vmware SRM
  • vIDM
  • Air Watch
  • Cloud Proxy appliances

User Guide

Compare product to each other based on performance metrics (CPU, Memory, Disk Latency, IOPS, Contention, etc)

Scroll over to the right to get configuration metrics

Highlight any VM and scroll to the bottom to view alerts and properties of the VM

Instructions on how to Import Dashboard

To import in version 7.0 and above

  1. First unzip the file you just downloaded, it will contain a dashboard and a view file
  2. Go to Dashboards > Actions > Manage Dashboards

  3. Hit the dropdown and select Import Dashboards. Import the Dashboard.zip file

  4. Next to go Views > Dropdown > Import. Import the View.zip file

  5. If you get any errors during the process, make sure to click overwrite before importing
twitterpinterestlinkedinmail


Download – VM Uptime Dashboard for vROPS 8.2+

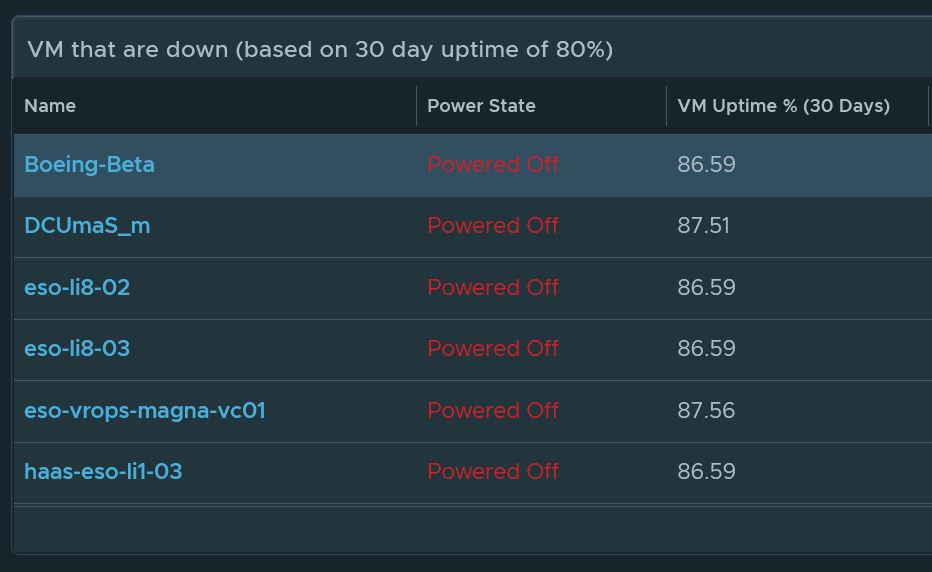
The VM uptime dashboard will keep track of any VMs that are currently down but has an uptime of more than 80% of the time for the last 30 days. A production VM should be up a majority of the time, therefore giving an uptime of over 80% for 30 days will eliminate a lot of VMs that are used for temporary testing, powered off majority of the time, VM templates, etc.

(Note you must have vROPS 8.2 for this to work)

Instructions

  1. You will need to install and active the uptime supermetric which you can download here first https://code.vmware.com/samples?id=7421
  2. Next download and install the dashboard and view here https://code.vmware.com/samples?id=7476

User Guide

  1. If any production VMs are down you will see it listed here. As you can see in the sample, the VMs are currently in a Powered Off State and the VM has a high uptime in the last 30 days.
  2. Select any of the VMs and you will see the uptime history in the graph below it. Use your mouse to hover when it went down to see exact dates and time when it went down.

How to Install the dashboard

To import in version 7.0 and above

  1. First unzip the file you just downloaded, it will contain a dashboard and a view file
  2. Go to Dashboards > Actions > Manage Dashboards

  3. Hit the dropdown and select Import Dashboards. Import the Dashboard.zip file

  4. Next to go Views > Dropdown > Import. Import the View.zip file

twitterpinterestlinkedinmail


How to Maximize all Monitoring Tools

Every time I walk into a new engagement with a Fortune 500 company, I always ask the customer the question “what are issues they want to address”. Of course, I always get these cool stories on how performance bottlenecks like high CPU and Memory slowed up their environment, how things are breaking left and right and no one knows about it, and how they would like to find out what is causing all their problems and outages. All companies want that magic 8-ball solution, something that will instantly identify and solve all their problems magically.

In the end, I am always handed a dozen requirements and sure I can just resolve those and be done with the engagement and then wait a few month later when new problems occur. By then, they might possibly ask for help again or even worst not use the tool at all and go back doing things the manual way or buy another tool thinking it will solve all their problems.

Based on my experience: All companies pain points are the same and the typical customer only mention 10% of what today’s top monitoring applications like vROPs can actually do. It is up to the expert to guide them towards to what I call “Monitoring 360 degrees” which basically means maximizing what a monitoring tool should be doing. When I say all companies pain point are the same it is because all their requirements will fall under these 6 categories below. (Disclaimer: this is all my own personal opinion)

All Monitoring Use Cases

  1. Being Proactive (Fix problems now to prevent future outages)
  2. Root Cause Analysis in minutes (Troubleshooting VM, Host, vCenter, etc)
  3. 24/7 Critical Monitoring (Monitoring critical Apps, Websites, Infrastructure)
  4. Capacity Management (Realizing Utilization, Growth, Inventory)
  5. Optimize Resources (Reclaiming Resources, which resources need more cpu & memory)
  6. Compliance (Hardening check, Environment consistency checks)

Now you probably thinking where are the reports, alerts, ticketing, and auto remediation? These are not use cases, these are bells and whistles that apply to all 6 use cases above. For example, anyone of those use cases mentioned above can involve reports and alerting for example if the customer wants it. I can easily create alerts on performance, capacity, compliance, etc.

With this being said, this is what all monitoring tools should consist of at a bare minimum.

VMignite.com Monitoring 360 Degree Checklist

  1. Proactive Dashboard
  2. Troubleshooting Dashboards
  3. 24/7 Critical Monitoring Dashboard
  4. Capacity Management Dashboards
  5. Optimization Dashboards
  6. Critical alerts being sent as email
  7. Selected Alerts being generated as tickets

Let me explain how some of this should work.

  1. Majority of companies are reactive, but they all want to be proactive – To achieve this, you need the following
    1. Health dashboard – you can’t begin to prevent problems before they happen when you have no idea what problems you have to begin with. That is why you need a dashboard that displays all the problems you have today (Host, vCenter, VMs, Datastores, Clusters, etc). Sounds difficult? Good thing is I created an environment health checker dashboard already if you have vROPs. It is the number one most downloaded dashboard on VMware code. Download it here http://www.vmignite.com/2021/02/vrops-vsphere-health-checker-dashboard-2-0/
    2. Alerts being sent out – Next you need to decide what alerts should be forwarded to your ticketing system and what should be sent as email alerts to engineers to fix immediately. If the alert that caused the outage doesn’t exist yet you will need to create it! I wrote a guide on this here:  http://www.vmignite.com/2021/06/vrops-alerting-dos-and-dont/
  2. When outages do happen, you need to figure out what caused it immediately. You will need the following:
    1. Troubleshooting dashboards – An excellent troubleshooting dashboard should be able to find root cause analysis in a minute! For example, to troubleshoot a problem VM in a minute, I will need to be able to eliminate the Host, Network, Physical Server, and Storage from the equation. On top of that I will need to be able to identify all VM bottlenecks such as CPU, Memory, contention, Disk Latency, application, configurations, etc. Sounds impossible to find root cause analysis in a minute? I have proven to be able to do this with all my customers. Sorry can’t share this dashboard, you can download some light versions of my troubleshooting dashboard on my download page
  3. All management, engineers, and operators need insight of the entire environment in one pane of glass
    1. 24/7 Critical Monitoring Dashboard – let’s say you want to monitor in one pane of glass an environment that consist of 20 vCenters, 1000 Host, 1000 Datastore, 100 Cluster, and 20,000 VMs. On top of that I want to monitor critical websites, vsan, and nsx as well. Also if a site is having problems, show me what objects are causing the problem using the same dashboard. This is a dashboard that I have created for my customers and they have dedicated monitors and even TVs to display throughout the company. Here is a simple version I created, the more advance one is for my customers: http://www.vmignite.com/2021/06/vrops-8-4-executive-dashboard-download/

Once again, all this is my own personal opinion but was based on my 8 year experience working for VMware as a consultant. To learn more granular features on what a powerful monitoring tool can do read the following

http://www.vmignite.com/2020/03/15-features-that-makes-vrops-the-best-monitoring-tool-period/

Updated: 1/09/2022

twitterpinterestlinkedinmail


Download – vROPS Cluster Uptime Checker Dashboard

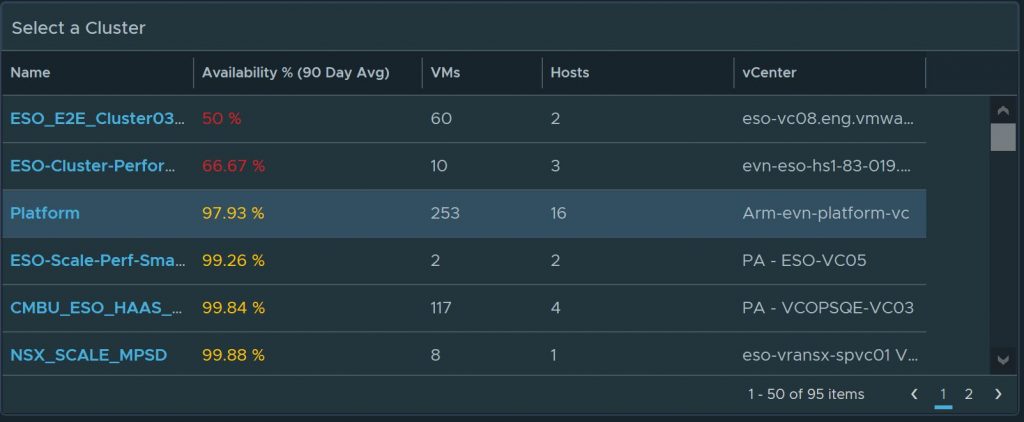
Management is always worrying about infrastructure uptime. They usually want to know if there were any unplanned outages in the last week? What about the past 30/60/90 days? And if there were any outages, what caused it? To answer these questions I have created the Cluster Uptime Checker dashboard. This dashboard will tell you the uptime % of all your clusters in the past 3 months by default. If the uptime is not 100% for the entire cluster, you can use the dashboard to identify which ESXi host were down for the past 7 days and even 30/60/90 days. You can also use the dashboard to identify if the ESXi host was down because of hardware failures, network failures, ip conflict, etc. Below is a guide on how to use the dashboard.

Download Here: https://code.vmware.com/samples?id=7375

Clearly view which vCenter Cluster had an ESXi Host outage in the past 3 months. Just select the Cluster to view which ESXi Host were having outages and when exactly did it happen. (Note: do not click on the name of the Cluster, click on the availability numbers to select it)

The next widget clearly shows I had at least one host outage sometime in April and in May.

The next widgets show me which Host were down in the past 7/30/60/90 days. As you can see from the diagram, there were uptime issues in the past 60 and 90 days caused by two ESXi Host. Select the Host from the list to see details on why it was down.

After selecting an ESXi Host, I can see see when the host was down. I can hover over with my mouse on the graph to get the exact date and time.

The Alerts widgets shows active and past alerts. I can quickly see there are storage sensor problems and a possible Physical NIC was down that could has casued the outage.

As an added bonus I even included all the properties of the ESXi Host so I can know which model, BIOS information, settings, etc

To import in version 7.0 and above

  1. First unzip the file you just downloaded, it will contain a dashboard and a view file
  2. Go to Dashboards > Actions > Manage Dashboards

  3. Hit the dropdown and select Import Dashboards. Import the Dashboard.zip file

  4. Next to go Views > Dropdown > Import. Import the View.zip file

twitterpinterestlinkedinmail


vROPS – Core Dashboard (vCenter and vROPS Monitoring)

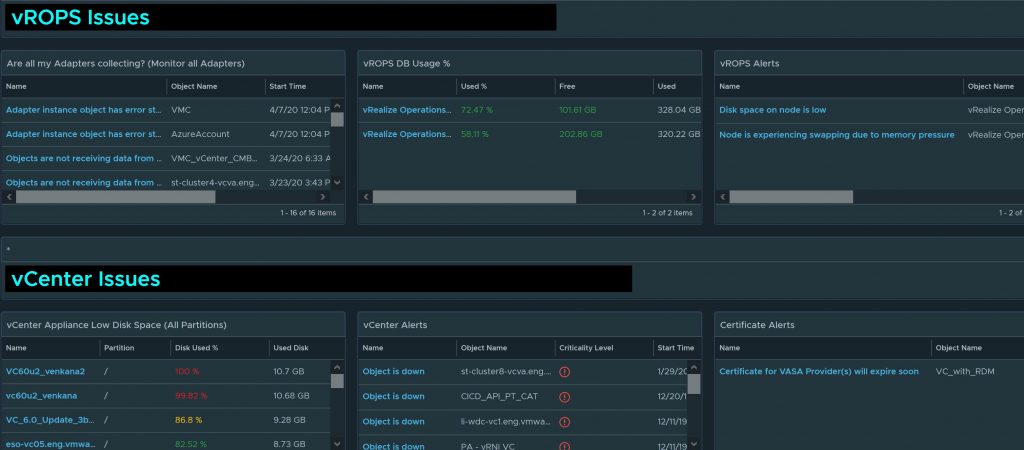
This is a must-have dashboard for those who wish to monitor vCenter Appliance partition disk space usage and vROPs disk space usage filling up as well. Both are critical as it can lead to an outage on both products. This dashboard covers the following.

  1. Are my vCenter Appliance Disk partitions filling up?
  2. Are all my vROPS adapters collecting?
  3. Is my vROPS out of space?
  4. vCenter Alerts (10+ Alerts)
  5. vROPS Alerts (30+ Alerts)

Below is a user guide and a walk through of the dashboard. The dashboard auto refreshes each widget every 5 minutes.

This Dashboard is not integrated with the Healthchecker Dashboard.  Download below

https://code.vmware.com/samples?id=5639#

See what adapters are not collecting. This widget monitors all configured adapters being collected by vROPS

Monitor vROPS Disk space issues. As some of you are already aware, if you run out of space, vROPS will go down.

Monitor over 30 alerts for vROPS. In the below example, it even detects memory swapping.

Monitors all partitions of the vCenter Appliance and sorted by the highest disk usage %. This alone makes this dashboard a must-have dashboard

Monitors over 10+ Alerts for vCenter Server

This widget monitors Certificates for vCenter and other products as well

To import in version 7.0 and above

  1. First unzip the file you just downloaded, it will contain a dashboard and a view file
  2. Go to Dashboards > Actions > Manage Dashboards

  3. Hit the dropdown and select Import Dashboards. Import the Dashboard.zip file

  4. Next to go Views > Dropdown > Import. Import the View.zip file

twitterpinterestlinkedinmail


Download – vSphere Complete Health Check Dashboard for vROPS 7+

One click and you can analyze everything wrong with your current vCenter Environment! From physical hardware issues, VM performance and configurations issues, Cluster Configurations issues, Datastore problems, ESXi Host performance, security, and configurations issues. Supports up to all levels of your virtual environment (vCenter, Datacenter, Clusters, and entire environment). This is one dashboard everyone must have! Read more details of this dashboard below


Download on VMware Code Exchange Here https://code.vmware.com/samples?id=5639#


Check the health of any vCenter Servers, Datacenter, Clusters, or entire environment (vSphere World)


Type in what you are looking for easy searching


Export anything you like to an Excel File for easy emailing. Also any of these widgets can be added to a report!


View VM Performance, Configuration, and Capacity Issues.


See the Weekly Averages to give you better insight on how longs it has been happening


Checks to make sure all your clusters setup for HA, DRS, and Admission Control. Also checks for Storage performance and capacity issues


Checks for over 18 Physical Host Issues. Also checks for ESXi Configuration, security, and performance problems such as HA disabled on individual host, Hyper-Threading not enabled, NTP, and more.

Download on VMware Code Exchange Here https://code.vmware.com/samples?id=5639#


To import in version 7.0 and above

  1. First unzip the file you just downloaded, it will contain a dashboard and and two view files
  2. Go to Dashboards > Actions > Manage Dashboards

  3. Hit the dropdown and select Import Dashboards. Import the Dashboard.zip file

  4. Next to go Views > Dropdown > Import. Import the View.zip file one by one.  Overwrite as needed


twitterpinterestlinkedinmail


Download – vROPS Hardware and configuration issues dashboard

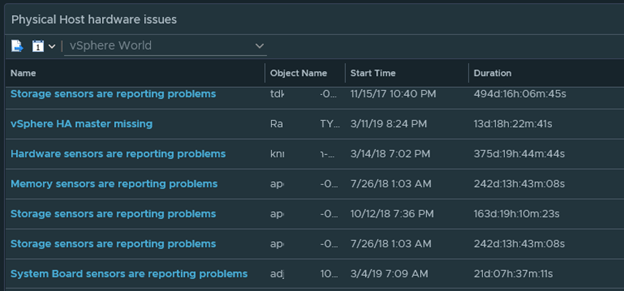
The purpose of this dashboard is to capture all the important issues with Physical Host Hardware, host network availability, storage availability, and vSwitch configuration issues. Out of the box, vROPS captures all these issues using alerts definitions. This dashboard filters these alerts and turn the data into something a lot more useful and way easier to manage. A guide on how I created this dashboard can be found here. Below is a guide on how to best use this dashboard


All physical host hardware issues are detected here. View memory, hardware, fan, temperature, voltage, system board issues, and more. Shows when it started and how long it has been happening.


Is the redundant networks on your host working properly? Are the Host networks on the host configured correctly? This part of the dashboards shows it all.


Storage configured correctly? I wouldn’t wait till an outage to find out.


This part of the dashboards checks if all your MTU and VLANs are configured correctly


Download the dashboard here >>>> Hardware Alerts Issues (1590 downloads )


You may also want to check out these other dashboards these other related dashboards uploaded by my coworker Joe Tietz.


To import in version 7.0 and above

  1. First unzip the file you just downloaded, it will contain a dashboard and a view file
  2. Go to Dashboards > Actions > Manage Dashboards

  3. Hit the dropdown and select Import Dashboards. Import the Dashboard.zip file

  4. Next to go Views > Dropdown > Import. Import the View.zip file


 twitterpinterestlinkedinmail


Download – VMware Inventory Dashboard for vROPS 7.0+

I don’t share out any advance dashboards on my blog, mainly because all my advances ones I keep exclusively to my customers.  I had to think a few times before I decided to share out this particular dashboard because of all the work I put into it.  Here is another must-have dashboard that monitors all VMs, Hosts, vCenters, and Datastores in your environment.  The performance metrics alone are worth the download by itself.  As an added bonus, on the bottom of the dashboard there is a display that shows all the latest VMs, Hosts, Datastore, etc collected.  Features of the dashboards are highlighted below

Note: Only download if you have vROPS 7.0 or above!


All Performance Metrics are color coded and each can be sorted

VMs


Click on the Export button to export to Excel

export

Scroll to the bottom to see Total and AveragestotAL


View the latest VMs, Datastores, Hosts, and vCenters collected

latest


Download here > VMware Inventory Dashboard (2091 downloads )


To import in version 7.0 and above

  1. First unzip the file you just downloaded, it will contain a dashboard and a view file
  2. Go to Dashboards > Actions > Manage Dashboards

  3. Hit the dropdown and select Import Dashboards. Import the Dashboard.zip file

  4. Next to go Views > Dropdown > Import. Import the View.zip file


 twitterpinterestlinkedinmail


Download – vROPS Environment Growth Dashboard for vROPS 7.0+

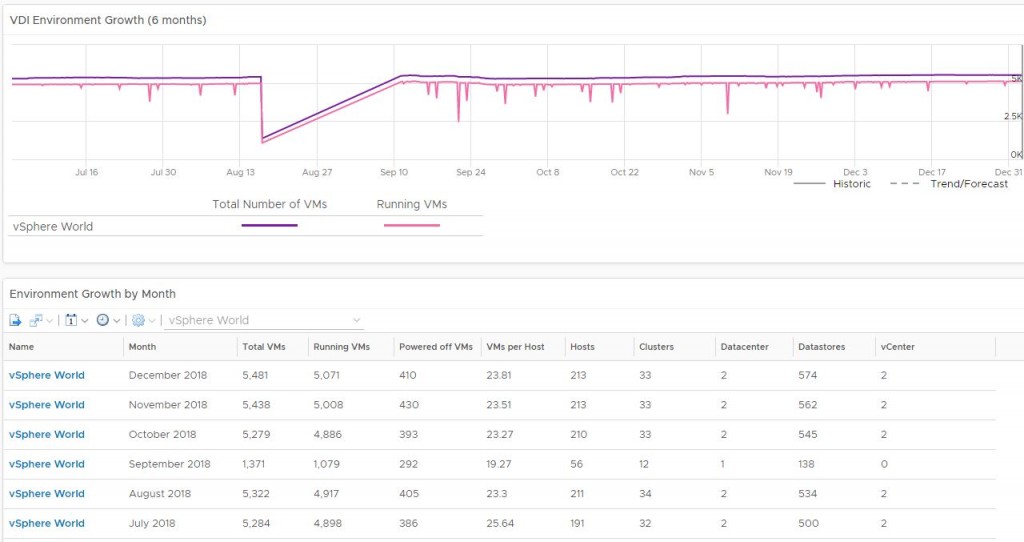
Here is my latest enhancement of the Environment Growth Dashboard. This dashboard allows Engineers, Operators, and Managers to view growth for VMs, Hosts, Datastores, Capacity, and more in the last 6 months.

Download here > VM Growth Dashboard (5445 downloads )


vmgrowth

vmgrowth2

To import in version 6.6 and above

  1. First unzip the file you just downloaded, it will contain a dashboard and a view file
  2. Go to Dashboards > Actions > Manage Dashboards


  3. Hit the dropdown and select Import Dashboards. Import the Dashboard.zip file


  4. Next to go Views > Dropdown > Import. Import the View.zip file


twitterpinterestlinkedinmail


Download – VM Troubleshooting Dashboard for vROPS 7.0+

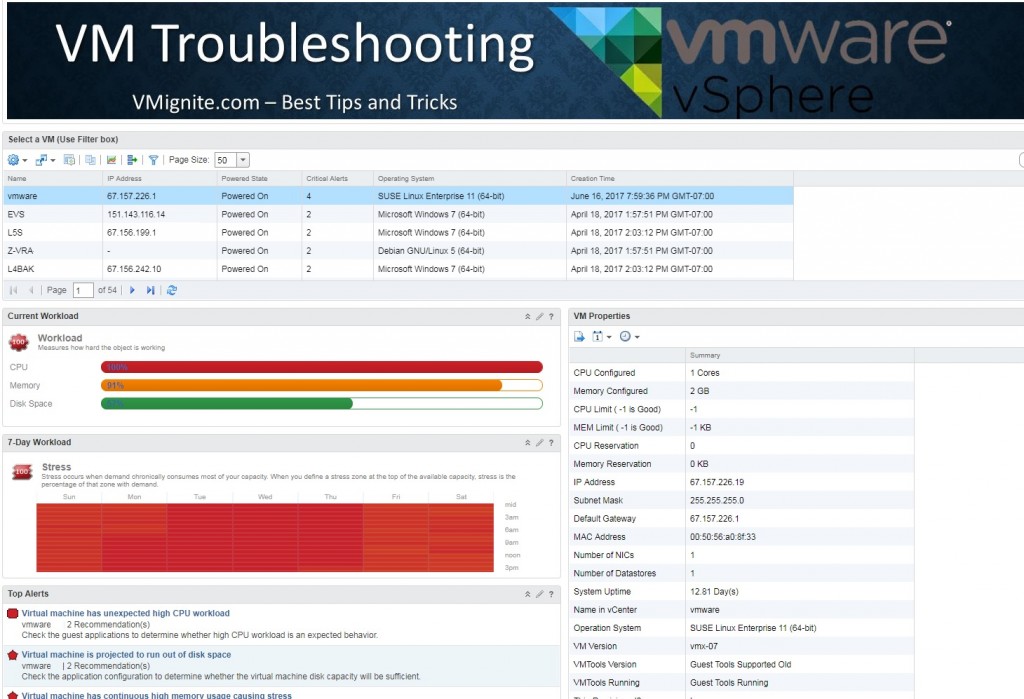
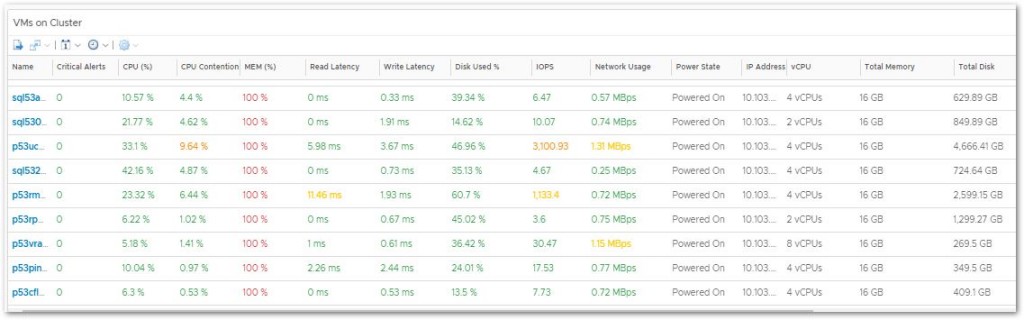
I have updated the VM Troubleshooting Dashboard for up to Version 7.0.  This is a must-have dashboard for any environment out there and people have told me it is way better than the out of the box one that comes with vROPS.  Also make sure to click on the Download tab and download the Host and Datastore troubleshooting dashboards as well.  Make sure you check the boxes overwrite files when importing.


New Enhancements

  • Now able to see Parent Datastore
  • View SRM Placement (If applicable)
  • Be able to sort the VMs by CPU% or Memory %
  • Added a live performance scoreboard
  • Added new UI enhancements that greatly improves the look of the dashboard
  • Change from Memory Workload % to Memory Usage % for better accurancy


VM Troubleshooting by VMignite.com Dashboard Benefits

  • Troubleshoot VM Issues quickly by identifying root cause analysis
  • View the history of when the problem started (24 hours, last week, last month, last 6 months, etc)
  • View all the VM Properties without going to vCenter and jumping through many settings
  • View what is connected to the VM (Host, Datastores, Folders, etc)


vROPS Version 6.6 and 6.7 Download Here VM Troubleshooting Dashboard 7.0 (5277 downloads )

Troubleshooting Guide Download Here VM Troubleshooting Guide (4199 downloads )


To import in version 6.6 and above

  1. First unzip the file you just downloaded, it will contain a dashboard and a view file
  2. Go to Dashboards > Actions > Manage Dashboards

  3. Hit the dropdown and select Import Dashboards. Import the Dashboard.zip file

  4. Next to go Views > Dropdown > Import. Import the View.zip file


 twitterpinterestlinkedinmail


Download – vROPS 7.0 Datastore Troubleshooting Dashboard

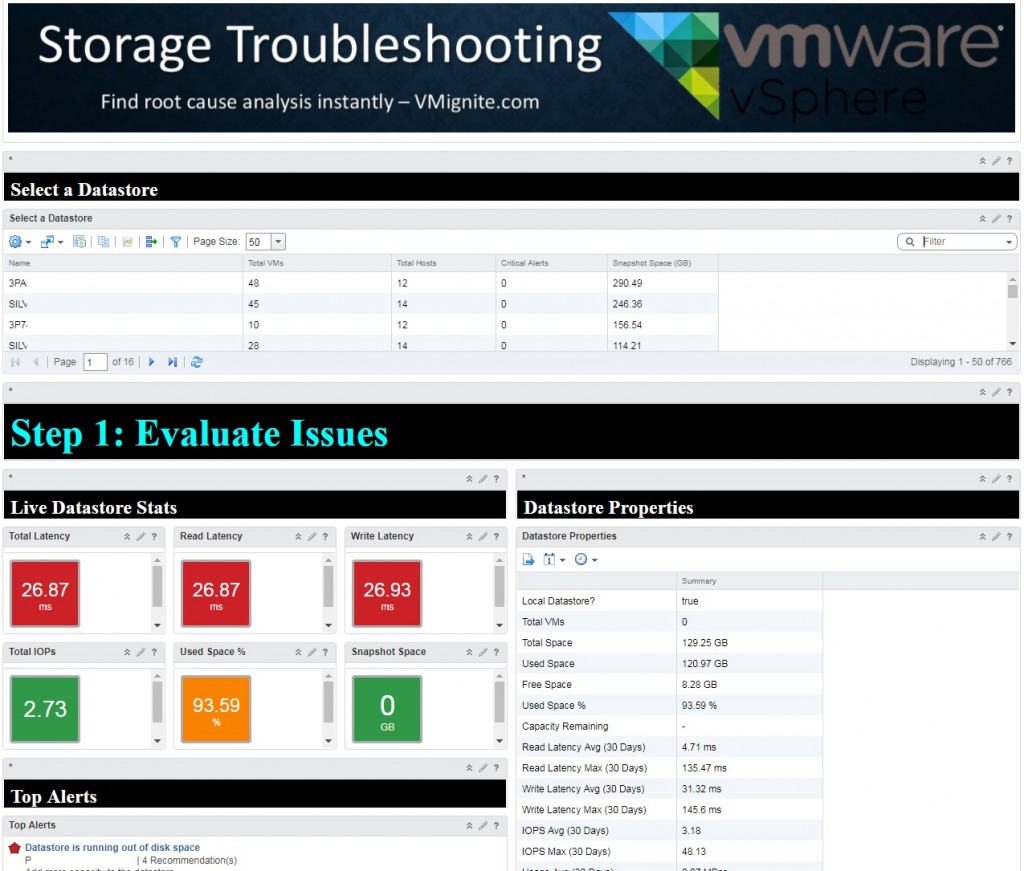
This is an updated version of my popular vROPS Datastore Troubleshooting Dashboard.  I updated and enhanced my dashboard up to vROPS Version 7.0.  Also check out my other dashboards on the Download Tab.

  • Quickly Troubleshoot Datastore Issues
  • Identify if there are any capacity bottlenecks
  • View the history of when the problem started
  • View all the Datastore Properties
  • View what is connected to the Datastore
  • View all the VMs on the Datastore and some useful VM related stats

vROPs All Version Download Here -> Datastore Troubleshooting Dashboard (3410 downloads )


To import in version 6.6

  1. First unzip the file you just downloaded, it will contain a dashboard and a view file
  2. Go to Dashboards > Actions > Manage Dashboards

  3. Hit the dropdown and select Import Dashboards. Import the Dashboard.zip file

  4. Next to go Views > Dropdown > Import. Import the View.zip file


To import in version 6.x
To Import the dashboard go to Content > Dashboard > Import Dashboards
and import Dashboard.zip file


To Import the views go to Content > Views > Import
and import Dashboard.xml file

importtwitterpinterestlinkedinmail


Download – VM Host Troubleshooting for vROPs 7.0

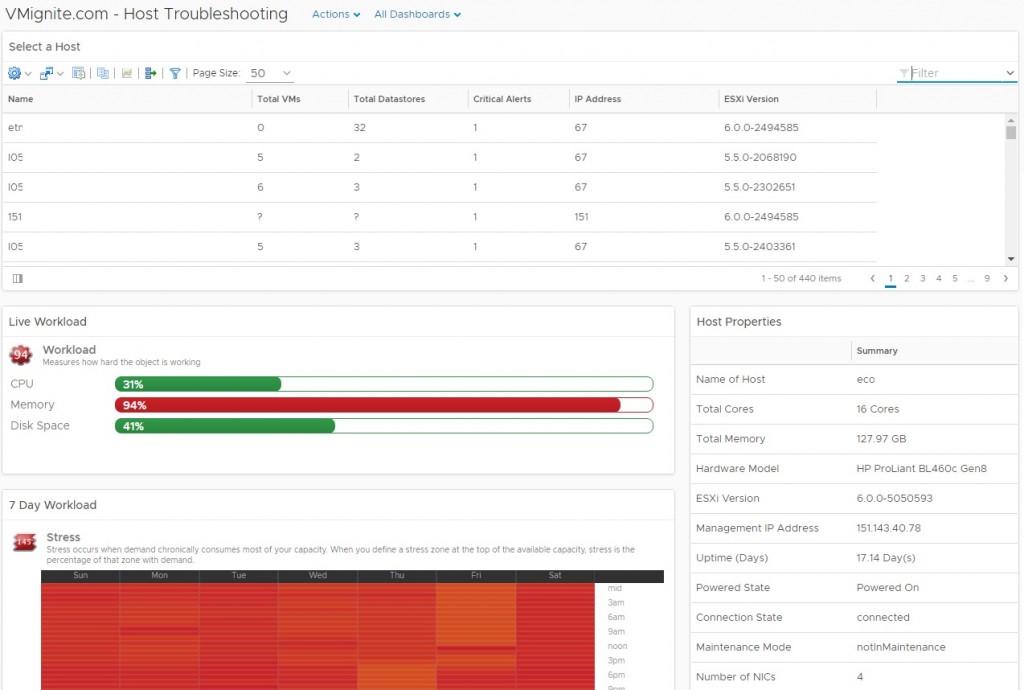
Here is the latest Host Troubleshooting dashboard that was enhanced and fixed up to the latest version of vROPs 7.0.  Besides fixing some of the metrics, I’ve enhanced almost every part of the dashboard.  I will post the latest Datastore and VM Troubleshooting Dashboards soon.

  • Quickly Troubleshoot Host Issues
  • Identify if there are any capacity bottlenecks
  • View the history of when the problem started
  • View all the Host Properties
  • View what is connected to the Host
  • View all the VMs on the Host and some useful VM related stats

vROPs All Version Download Here -> Host Troubleshooting Dashboard (4205 downloads )

vROPS Host Troubleshooting Guide Download Here -> Host Troubleshooting Guide (3540 downloads )


To import in version 6.6

  1. First unzip the file you just downloaded, it will contain a dashboard and a view file
  2. Go to Dashboards > Actions > Manage Dashboards

  3. Hit the dropdown and select Import Dashboards. Import the Dashboard.zip file

  4. Next to go Views > Dropdown > Import. Import the View.zip file


To import in version 6.x
To Import the dashboard go to Content > Dashboard > Import Dashboards
and import Dashboard.zip file


To Import the views go to Content > Views > Import
and import Dashboard.xml file

importtwitterpinterestlinkedinmail