I have updated the VM Troubleshooting Dashboard for up to Version 7.0. This is a must-have dashboard for any environment out there and people have told me it is way better than the out of the box one that comes with vROPS. Also make sure to click on the Download tab and download the Host and Datastore troubleshooting dashboards as well. Make sure you check the boxes overwrite files when importing.
New Enhancements
- Now able to see Parent Datastore
- View SRM Placement (If applicable)
- Be able to sort the VMs by CPU% or Memory %
- Added a live performance scoreboard
- Added new UI enhancements that greatly improves the look of the dashboard
- Change from Memory Workload % to Memory Usage % for better accurancy
VM Troubleshooting by VMignite.com Dashboard Benefits
- Troubleshoot VM Issues quickly by identifying root cause analysis
- View the history of when the problem started (24 hours, last week, last month, last 6 months, etc)
- View all the VM Properties without going to vCenter and jumping through many settings
- View what is connected to the VM (Host, Datastores, Folders, etc)
vROPS Version 6.6 and 6.7 Download Here VM Troubleshooting Dashboard 7.0 (6575 downloads )
Troubleshooting Guide Download Here VM Troubleshooting Guide (5248 downloads )
To import in version 6.6 and above
-
First unzip the file you just downloaded, it will contain a dashboard and a view file
-
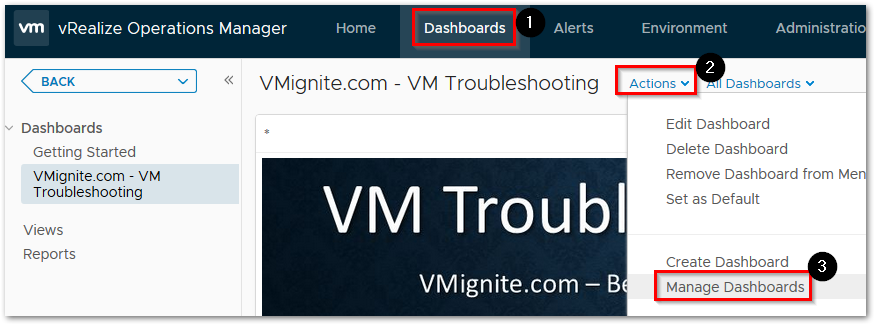
Go to Dashboards > Actions > Manage Dashboards
-
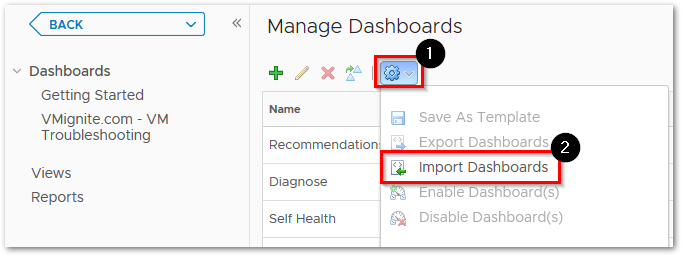
Hit the dropdown and select Import Dashboards. Import the Dashboard.zip file
-
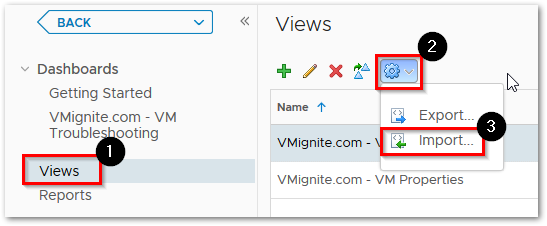
Next to go Views > Dropdown > Import. Import the View.zip file