Download – vROPS 7.0 Datastore Troubleshooting Dashboard
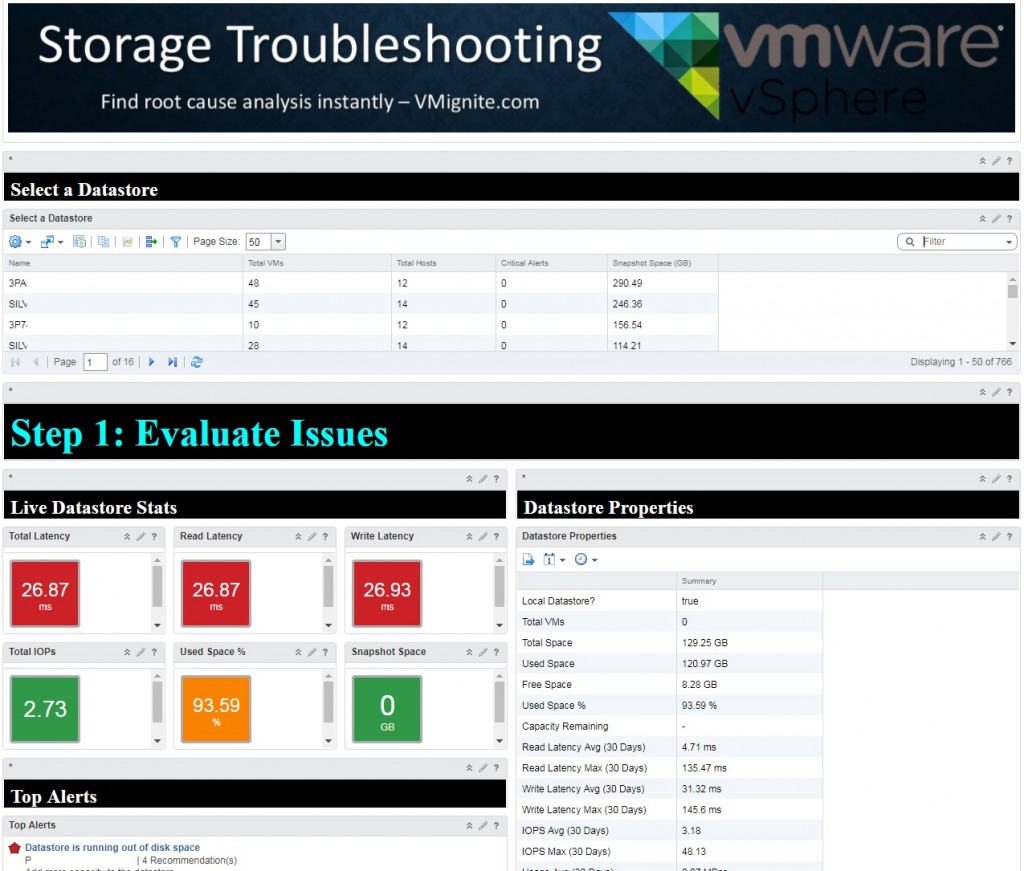
This is an updated version of my popular vROPS Datastore Troubleshooting Dashboard. I updated and enhanced my dashboard up to vROPS Version 7.0. Also check out my other dashboards on the Download Tab.
- Quickly Troubleshoot Datastore Issues
- Identify if there are any capacity bottlenecks
- View the history of when the problem started
- View all the Datastore Properties
- View what is connected to the Datastore
- View all the VMs on the Datastore and some useful VM related stats
vROPs All Version Download Here -> Datastore Troubleshooting Dashboard (3395 downloads)
To import in version 6.6
-
First unzip the file you just downloaded, it will contain a dashboard and a view file
-
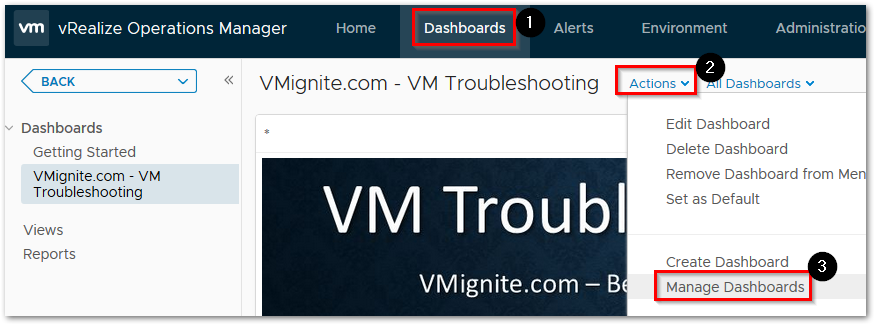
Go to Dashboards > Actions > Manage Dashboards
-
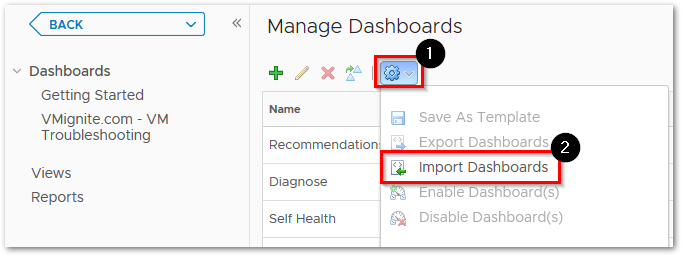
Hit the dropdown and select Import Dashboards. Import the Dashboard.zip file
-
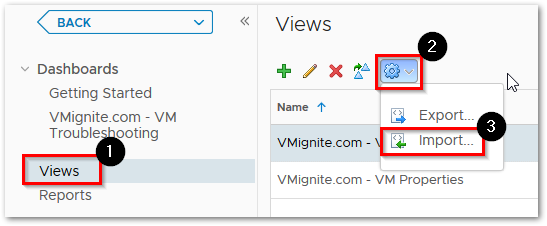
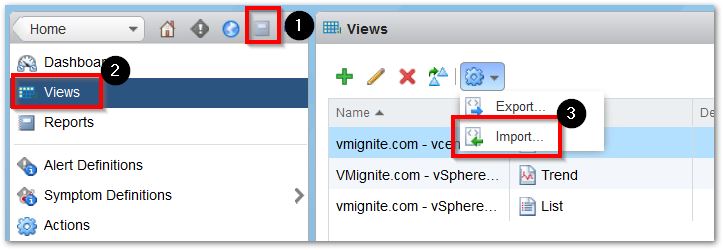
Next to go Views > Dropdown > Import. Import the View.zip file
To import in version 6.x
To Import the dashboard go to Content > Dashboard > Import Dashboards
and import Dashboard.zip file

To Import the views go to Content > Views > Import
and import Dashboard.xml file



First let me say thank you for your awesome dashboards. Seeing a few today my face lit up as I have been looking for many of these types and not sure how I didn’t know about these before.
However I am trying to import the datastore troubleshooting view and I get the following error. The Dashboard imported with no issues.
Views with the same IDs as ‘VMignite.com – Text Evaulate Current Issues’, ‘VMignite.com – Text Evaluate History’ already exist.
I have imported vmware inventory, vm troubleshooting and env growth. not sure if there is a conflict or what? Any help would be greatly appreciated.
Thank you again,
GB
Some of the dashboards use the same text views. Therefore make sure you check the box to “Overwrite if there is conflict”. This will resolve your problem. Glad you like the dashboards.