vROPS 6 – How to use the Interval Breakdown feature
Posted in vROPs
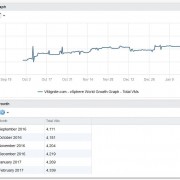
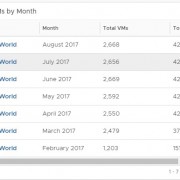
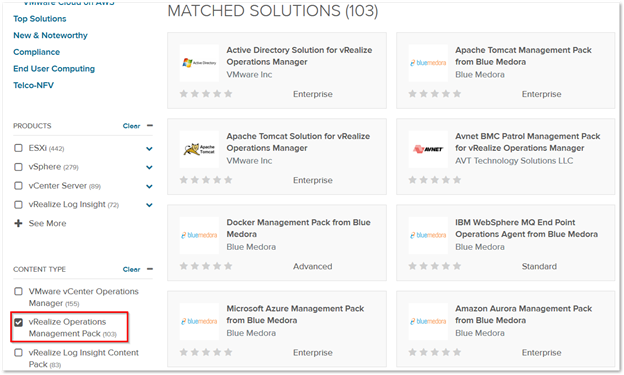
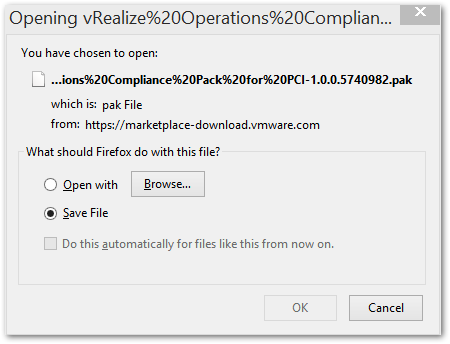
The interval breakdown feature is located in the View widget. This feature is very useful when you would like to see a metric or property at a certain point in time. For example the growth of VMs in the past 6 months. You can choose to display the results in hours, days, weeks, month, quarter, and a year. To download this dashboard that has already been created with an included graph, just click here
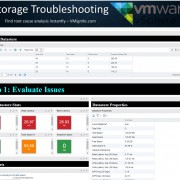
6-Month VM and Host Growth detailed View
The following guide will show you how to use the Interval breakdown feature to create a 6-Month VM and Host Growth of your entire environment
-
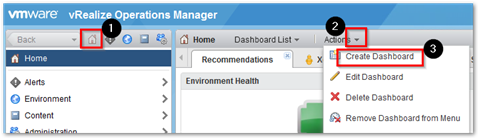
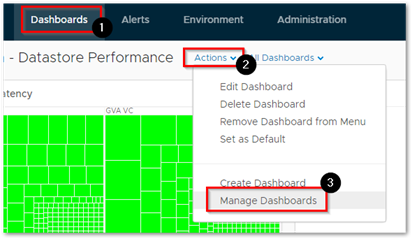
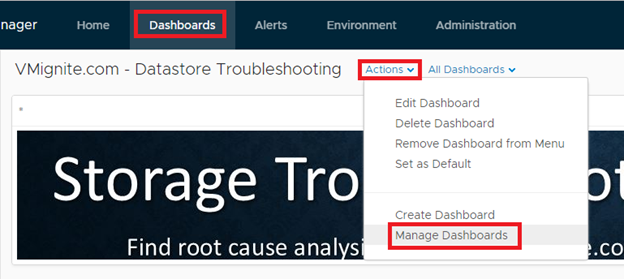
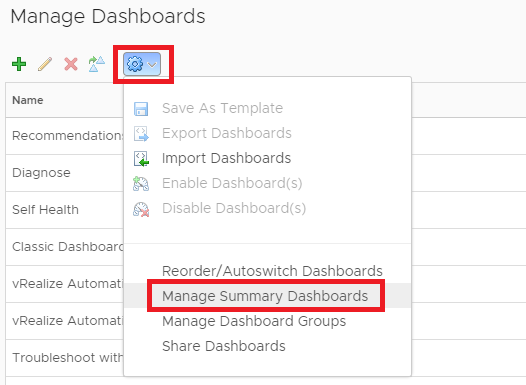
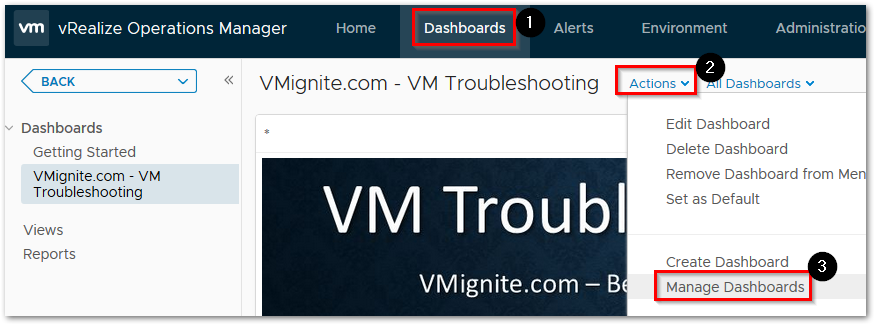
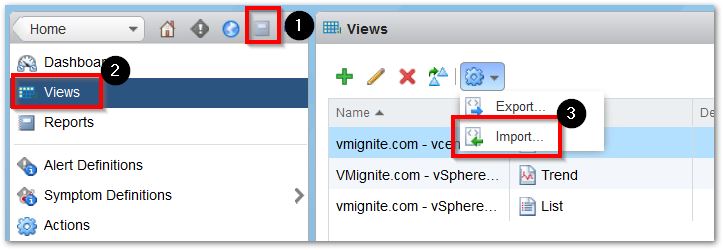
First we will need to create the dashboard. Click on Dashboards > Actions >
Create Dashboard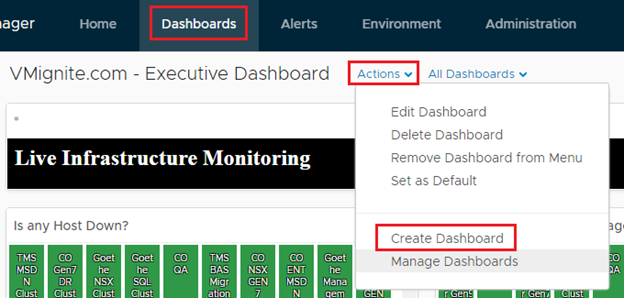
-
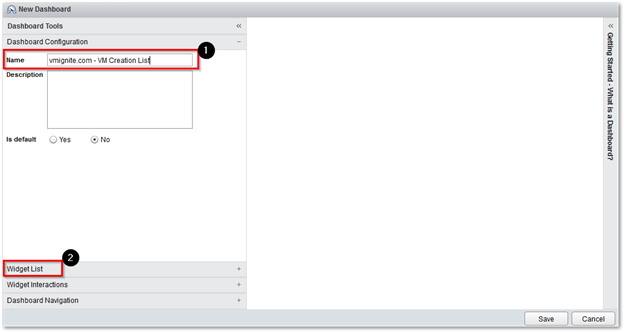
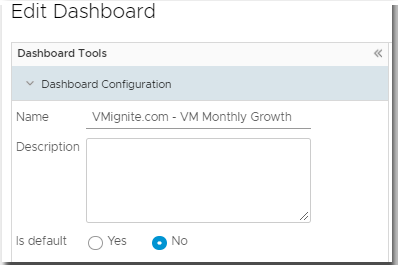
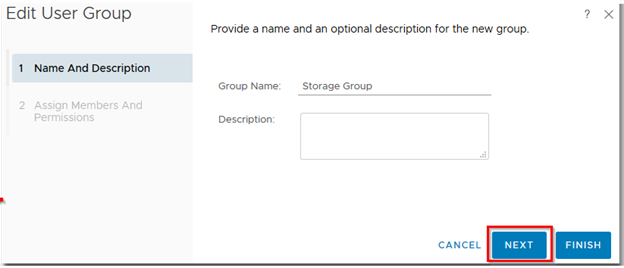
Add a name (Example: Company Name – VM Monthly Growth)
-
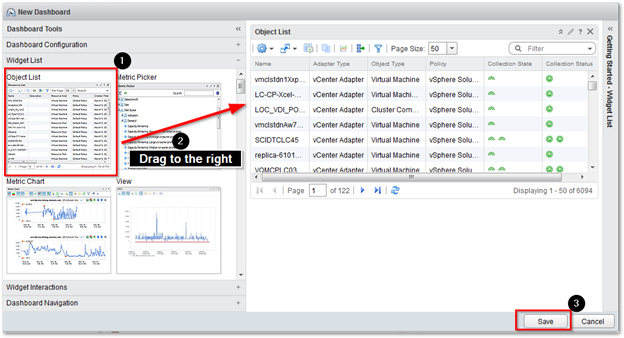
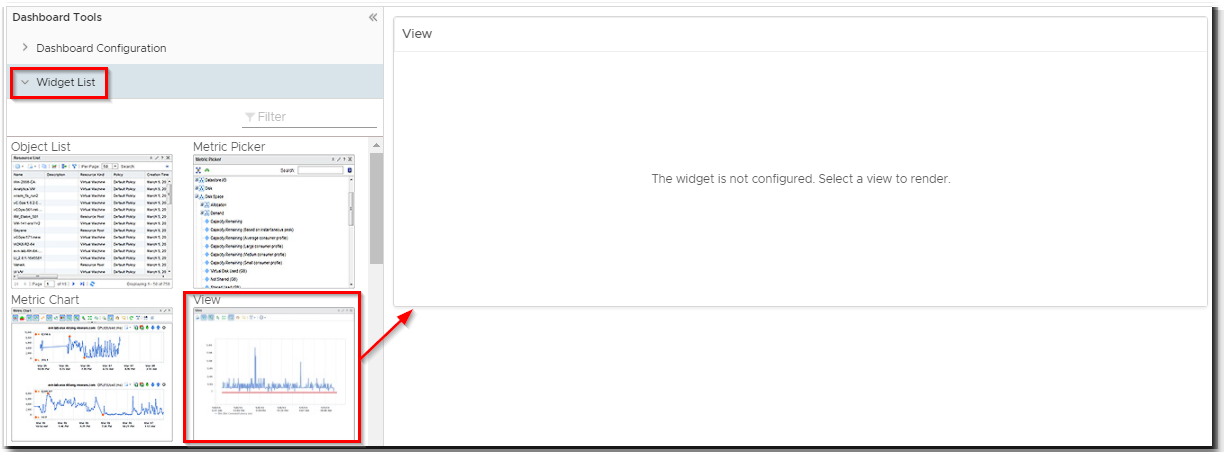
Under Widget List, drag and drop a view widget to the right side
-
Click on Save, you should now be able to see your dashboard
-
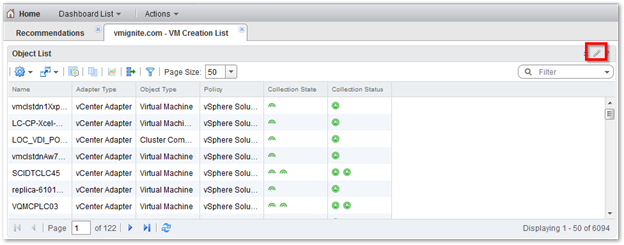
Click on the Pencil icon on the View widget
-
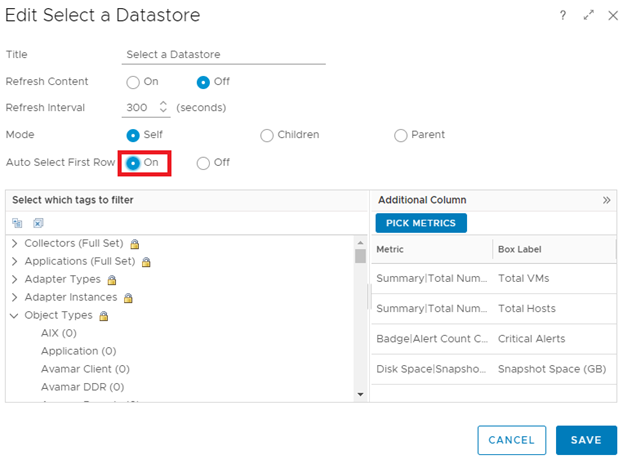
Enter Total VMs by Month for the title and turn on Self Provider. This allows us to select an object below.

-
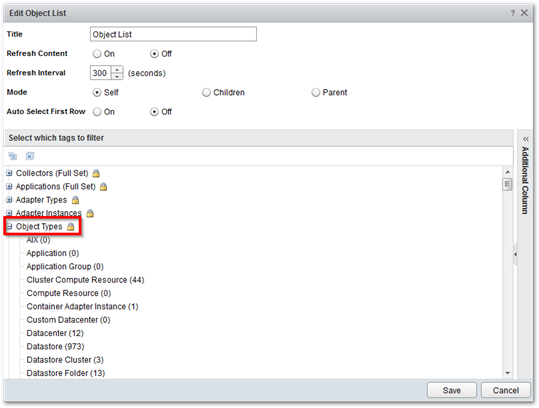
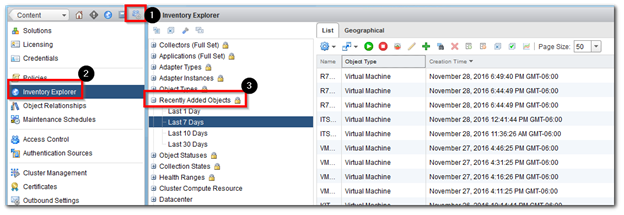
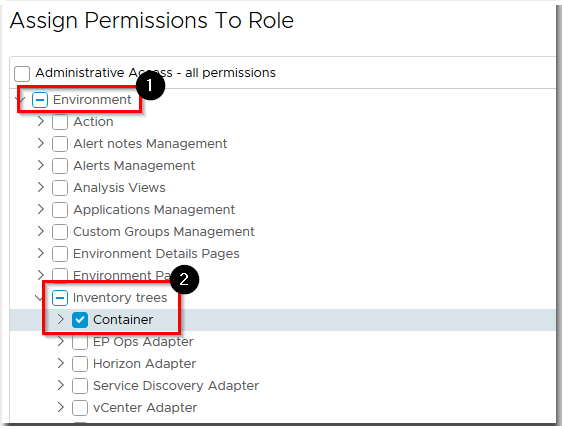
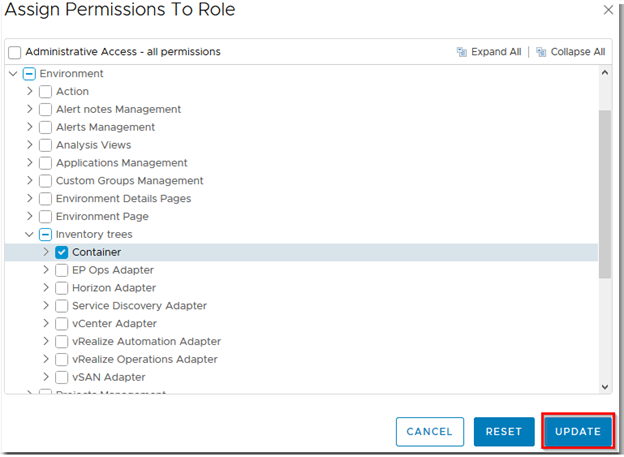
Hit the dropdown below Select Object and then select All Objects
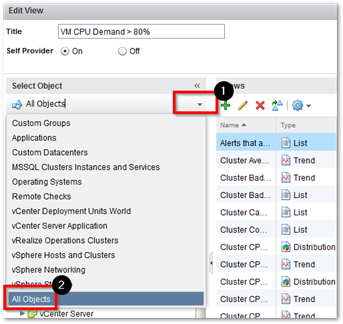
- Expand vCenter Adapter > vSphere World and then select vSphere World (This ensures we include everything in the vCenter Adapter regardless of how many vCenters are in the environment). Then click on
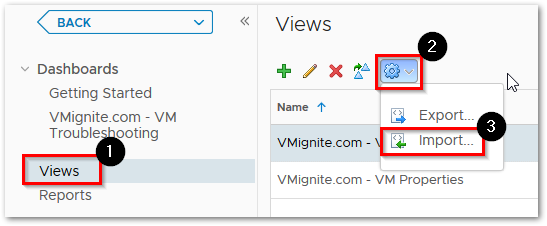
 to add a new view
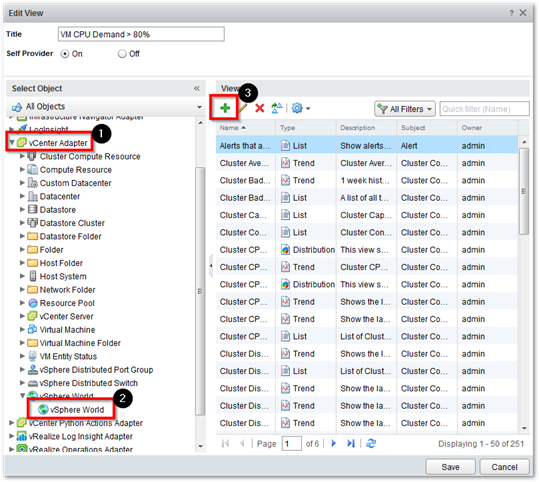
-
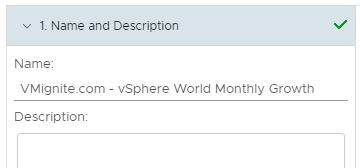
Give it a Name
-
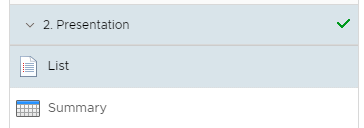
Click on Presentation and then select List
-
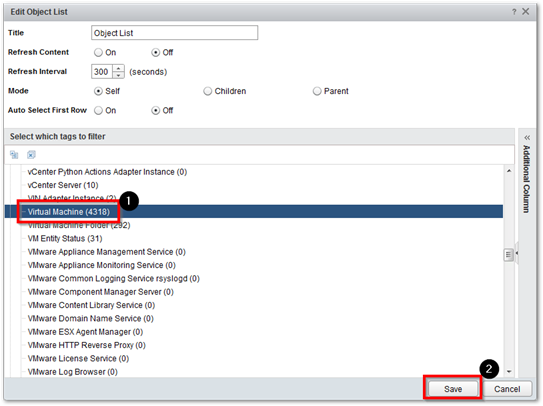
Under Subjects, Hit the dropdown and select vCenter Adapter >
vSphere World -
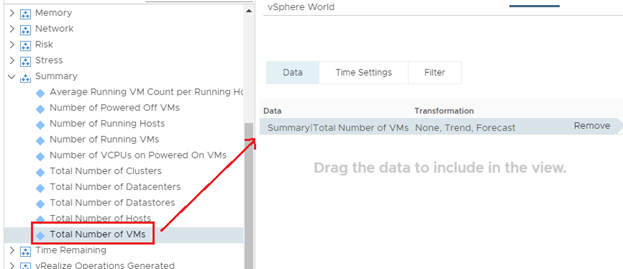
Under Data, select Summary > Total Number of VMs metric by double clicking on it till it shows up on the right side. Also add Summary > Total Number of Hosts
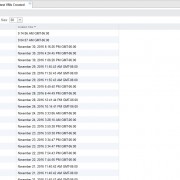
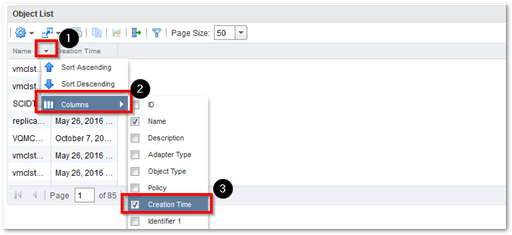
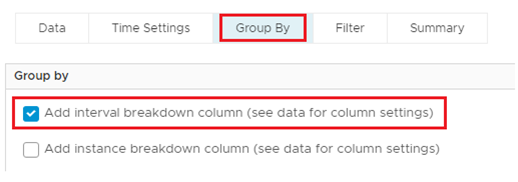
- Click on Group By tab and check the box Add interval breakdown column
-
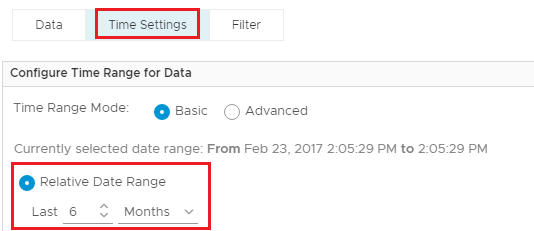
Since we want 6 months of past history, click on Time Settings and change the Relative Date Range to 6 Months
-
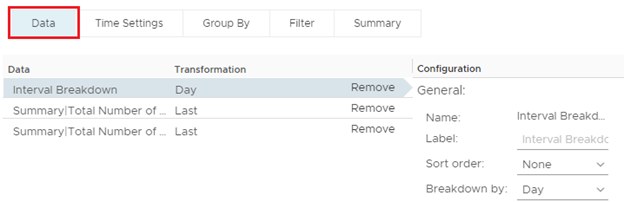
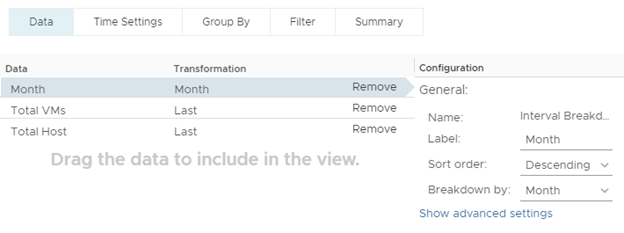
Now go back to Data tab in the middle
-
Configure the following
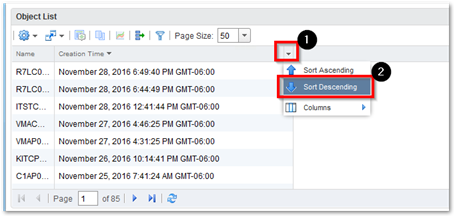
- Select Interval Breakdown and Change the Metric Label to Month. Change Sort Order to Descending
- Select Summary|Total Number of VMs and Change the Metric Label to Total VMs
-
Select Summary|Total Number of Host and Change the Metric Label to Total Hosts
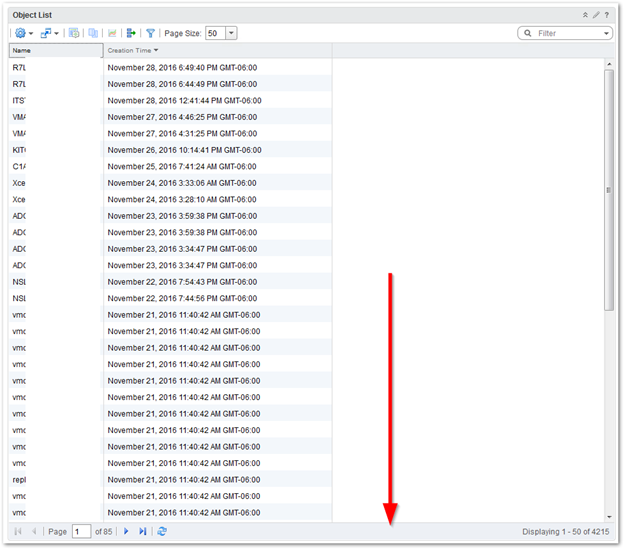
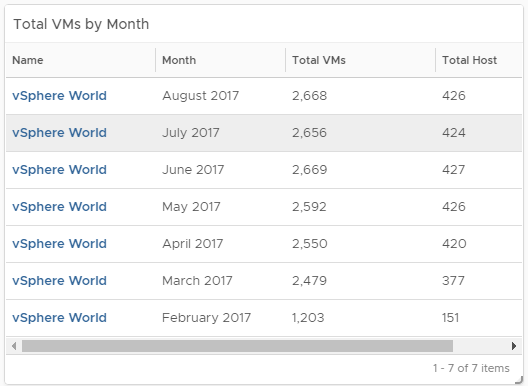
- Click on Save and then Save again. You should now see a 6 month history of VM and Host Growth by months

 icon
icon 
 icon.
icon.


 sign to add a new custom symptom.


 to add a new recommendation


 sign on the left side to add an any additional vCenter Instance