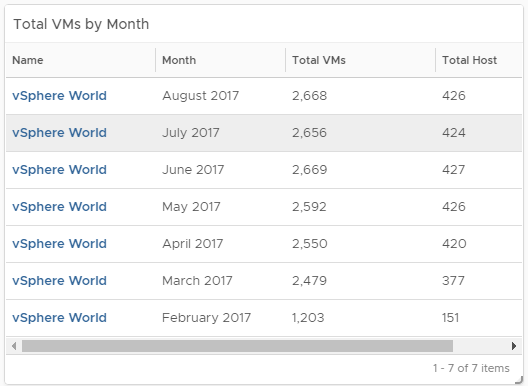
The interval breakdown feature is located in the View widget. This feature is very useful when you would like to see a metric or property at a certain point in time. For example the growth of VMs in the past 6 months. You can choose to display the results in hours, days, weeks, month, quarter, and a year. To download this dashboard that has already been created with an included graph, just click here
6-Month VM and Host Growth detailed View
The following guide will show you how to use the Interval breakdown feature to create a 6-Month VM and Host Growth of your entire environment
-
First we will need to create the dashboard. Click on Dashboards > Actions >
Create Dashboard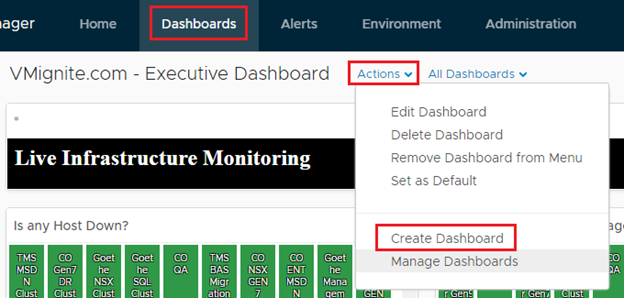
-
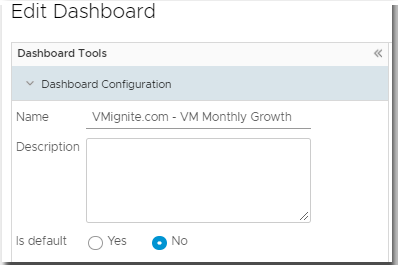
Add a name (Example: Company Name – VM Monthly Growth)
-
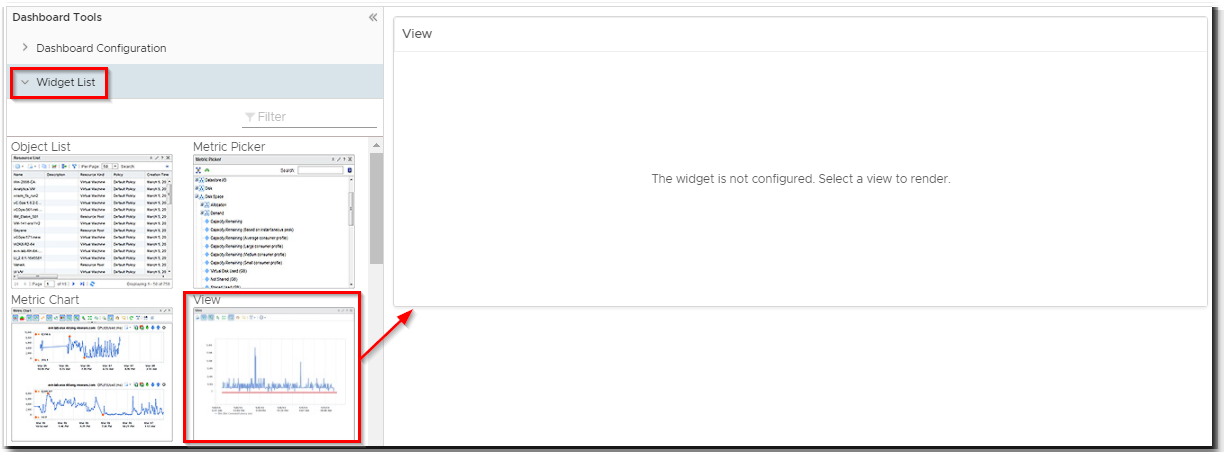
Under Widget List, drag and drop a view widget to the right side
-
Click on Save, you should now be able to see your dashboard
-
Click on the Pencil icon on the View widget
-
Enter Total VMs by Month for the title and turn on Self Provider. This allows us to select an object below.

-
Hit the dropdown below Select Object and then select All Objects
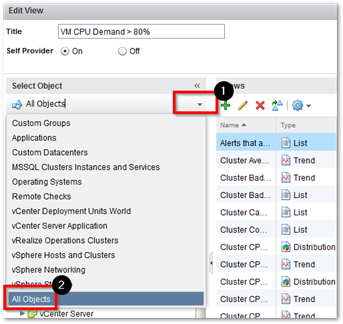
- Expand vCenter Adapter > vSphere World and then select vSphere World (This ensures we include everything in the vCenter Adapter regardless of how many vCenters are in the environment). Then click on
 to add a new view
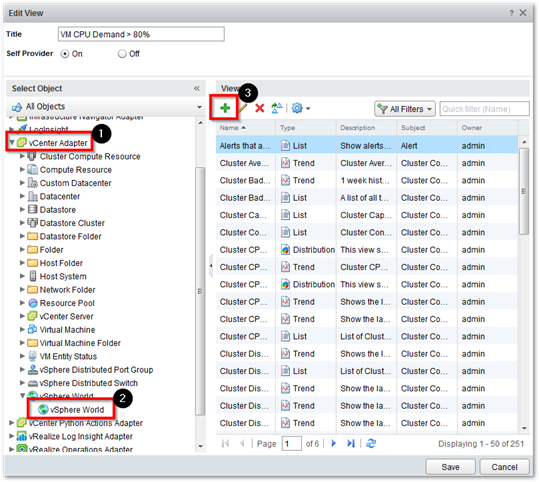
-
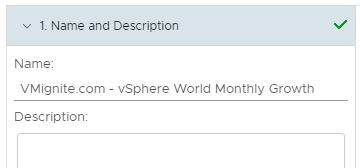
Give it a Name
-
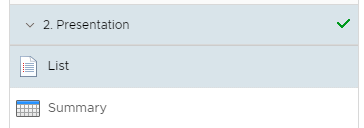
Click on Presentation and then select List
-
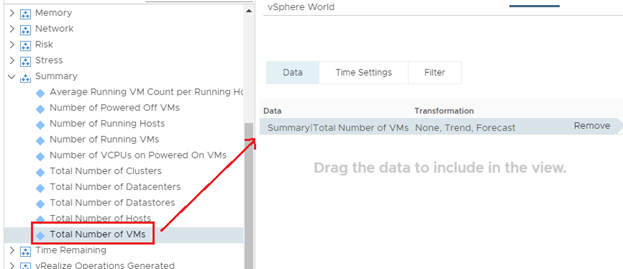
Under Subjects, Hit the dropdown and select vCenter Adapter >
vSphere World -
Under Data, select Summary > Total Number of VMs metric by double clicking on it till it shows up on the right side. Also add Summary > Total Number of Hosts
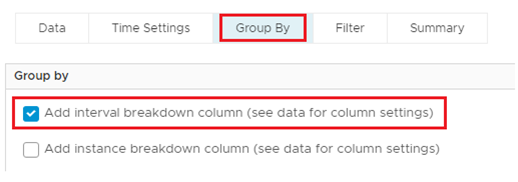
- Click on Group By tab and check the box Add interval breakdown column
-
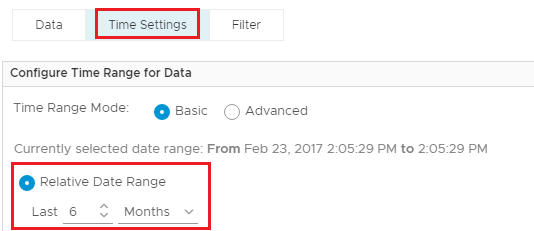
Since we want 6 months of past history, click on Time Settings and change the Relative Date Range to 6 Months
-
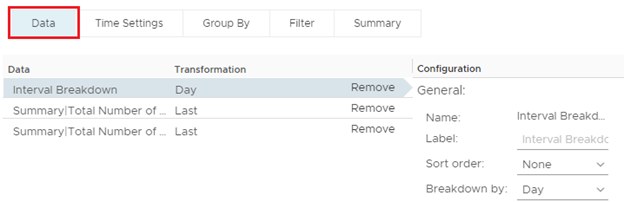
Now go back to Data tab in the middle
-
Configure the following
- Select Interval Breakdown and Change the Metric Label to Month. Change Sort Order to Descending
- Select Summary|Total Number of VMs and Change the Metric Label to Total VMs
-
Select Summary|Total Number of Host and Change the Metric Label to Total Hosts
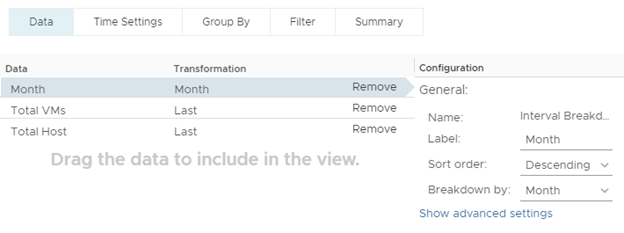
- Click on Save and then Save again. You should now see a 6 month history of VM and Host Growth by months