vROPS 6.7 has a lot of enhance features, however in this article I will talk about a specific enhancement that will add a lot of value to reports and dashboards. Using the View Widget, you can now add color (yellow, orange, red) to a metric when it meets a certain threshold. This is an excellent feature that will definitely enhance the user experience. The following guide will walk you through how to do this.
In this example we will modify one of the default views and add metric coloring to one of the metrics.
-
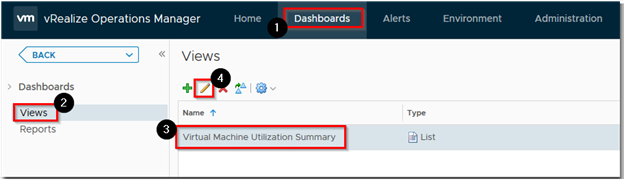
Click on Dashboards > Views and select the Virtual Machine Utilization Summary and click on Edit
-
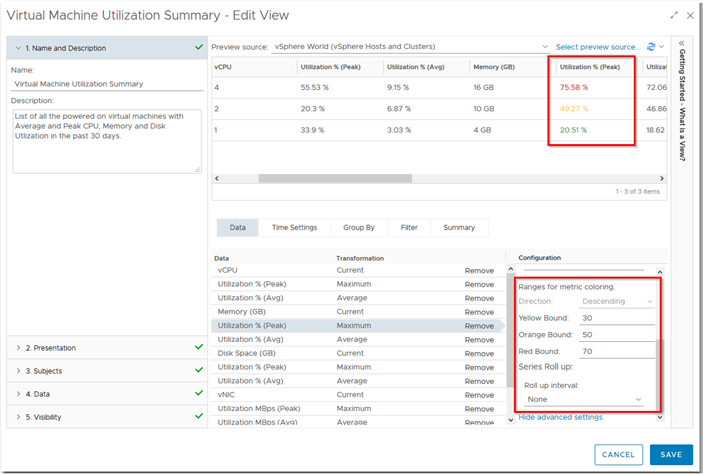
Under configuration on the bottom right, expand Advance Settings and select the Utilization % (Peak) metric. Configure it like below (below are just sample settings)
- Direction: Descending
- Yellow Bound: 30
- Orange Bound: 50
- Red Bound: 70
-
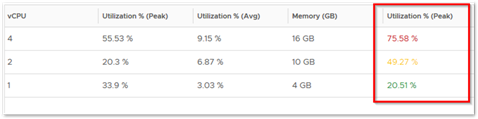
Refresh the preview on the Top, you should now see colors to that metric. You can choose to modify the numbers to your liking.
-
Click on Save if you want to save it.
-
As you can see this feature can definitely enhance your reporting and dashboard experience