Another great feature of vROPS 6.7 is the ability for a scoreboard to receive an interaction from another widget without the use of an XML Metric Configuration file. Using Metric Configuration files is an advance skill, therefore bypassing this will allow anyone to use the scoreboard with more ease. Note, to add Properties to a scoreboard you will still need to use a metric configuration file as only metrics are supported for now and you must be in Object Type mode for this functionality to work. Below is a guide on how to create a sample dashboard that leverages this new feature.
Step 1 – Create the Dashboard
The following sample will show you how to create a dashboard
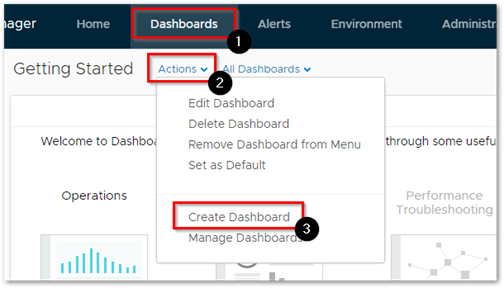
- Click on Dashboards > Actions > Create Dashboard
-
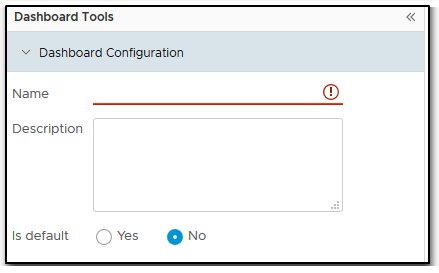
Configure the dashboard
-
Add a name for the Dashboard
-
-
Under Widget List, drag and drop an Object List widget and a Scoreboard to the right side. Reconfigure the widgets until it looks exactly like the following.
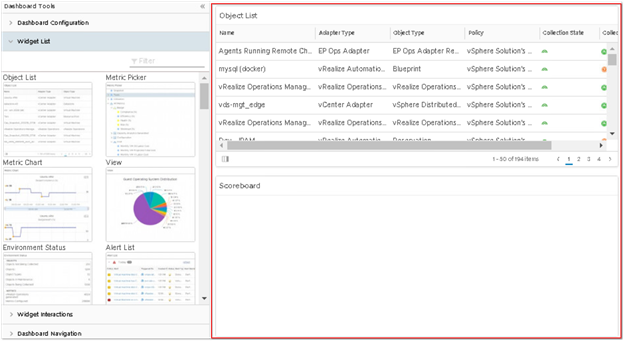
-
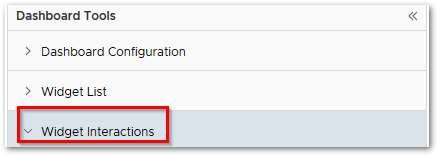
Next click on Widget Interactions
-
Look for Scoreboard and then hit the drop-down to the right of it and select Object List from the list and click on Apply Interactions. This will allow the Scoreboard widget to receive from the Object List

- Click on Save, you should now be able to see your dashboard on the left side menu (Open it in All Dashboard if you don’t see it listed).
Step 2 – Configure the dashboard
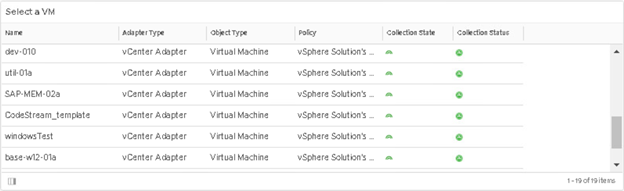
Select a VM Widget
In this procedure, we will filter out our Object List to show only Virtual Machines as we don’t really care about any other object.
-
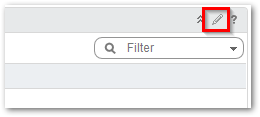
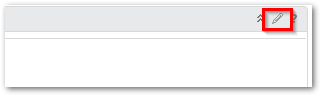
Click on the Pencil icon on the first View widget
-
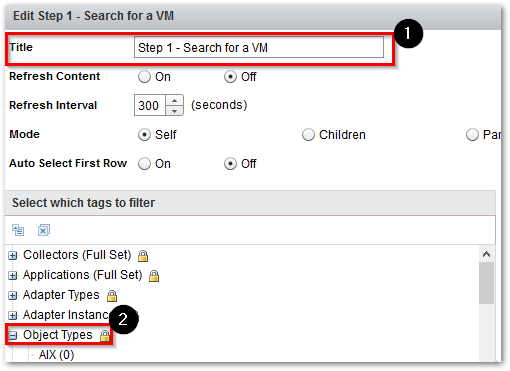
Provide a title such as Step 1 – Select a VM and then expand Object Types on the bottom
-
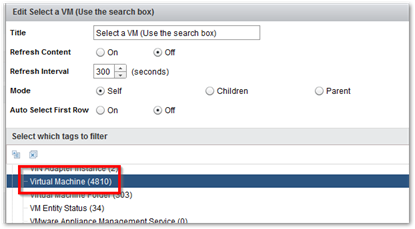
Scroll down till you see Virtual Machine and then select it. This applies the filter to only list Virtual Machine Objects and nothing else.
- Click on OK and then Click on Save
Scoreboard Widget
In this procedure, we will configure our scoreboard to show Virtual Machine metrics that we will manually choose.
-
Click on the Pencil icon on the first scoreboard to edit the scoreboard
-
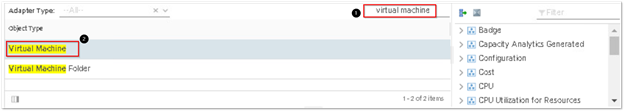
Search for Virtual Machines in the filter box and then Select it.
-
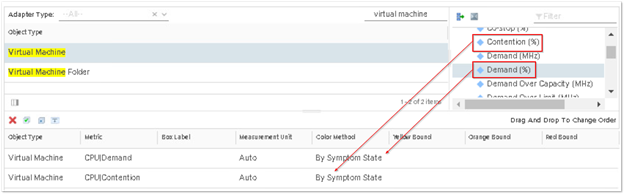
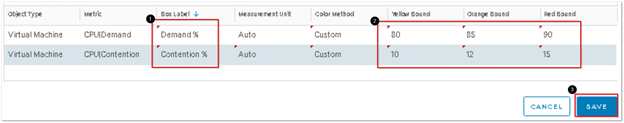
On the right side double click on the following metrics CPU | Demand(%) and CPU | Contention(%). Make sure it displays on the bottom.
-
Fill out the box label and add Yellow, Orange, and Red bounds for each metric. This will allow the box to turn that particular color when it meets that criteria. Click on Save
-
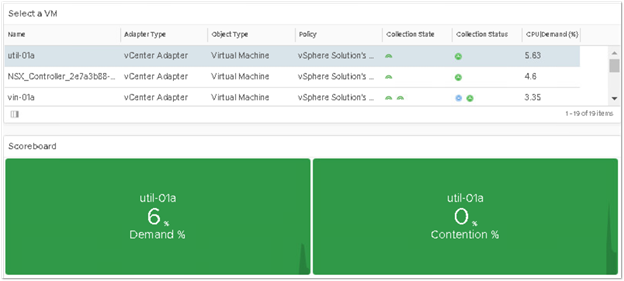
Now Select a VM and see the results below
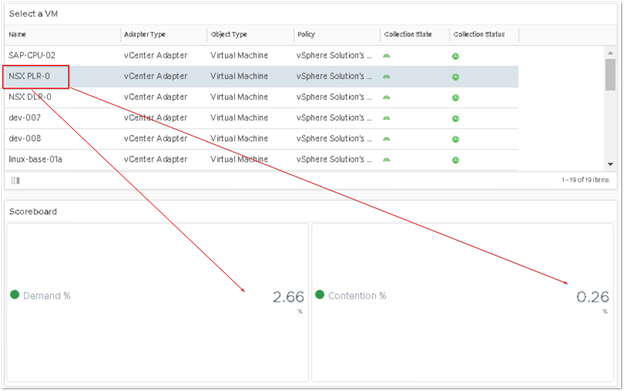
-
I like to Jazz my scoreboard up a little so here are some sample settings. I would like my scoreboard to auto refresh every minute, I don’t like seeing decimal points, I want the font size and box size to be a certain height, and I like to see more of a solid theme.
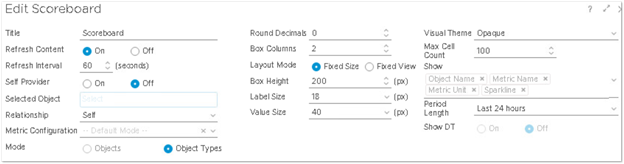
- The new scoreboard will now look like this.