This dashboard allows you to view your Virtual Machine growth numbers and trends. This is useful information for Engineers, Operators, and Managers who want to know how fast their VMware environment is growing. It displays a nice growth graph and also list Total VMs by the month. Instructions on importing the dashboard is below, notice there are two parts to upload. This dashboard was created in celebration of my vExpert awarded to me this year.
Download here >
VM Growth Dashboard (6698 downloads )
To Import the dashboard go to Content > Dashboard > Import Dashboards
and import VMignite.com – VM Growth Dashboard

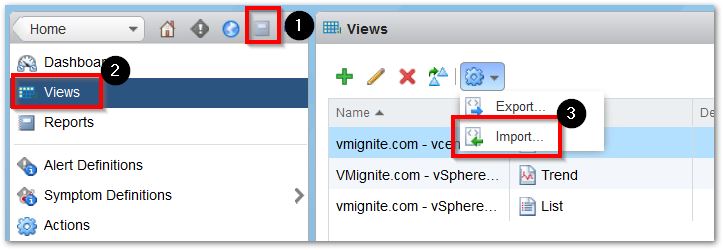
To Import the views go to Content > Views > Import
and import vmignite.com – vm growth views
Now go to Homepage and select VMignite.com – VM Monthly Growth from the dashboard list

Hello Lan,
What metrics can l use to generate the following report? Using vRops 6.4
Management wants to know how many vms and hosts get deployed monthly / quarterly / annually.
Thanks
There is no metric that I know of that can do that. Not even creating a super metric. However, you may want to export it to a CSV file and create a macro in Excel to calculate those figures for you. For example subtracting last month total with this months total in excel.
Ok thanks Lan