
vROPS 8.6 – How to create Alert Definitions using conditions
With the release of vROPS 8.6, creating alert definitions is easier than ever before. With the new addition of being […]
With the release of vROPS 8.6, creating alert definitions is easier than ever before. With the new addition of being […]
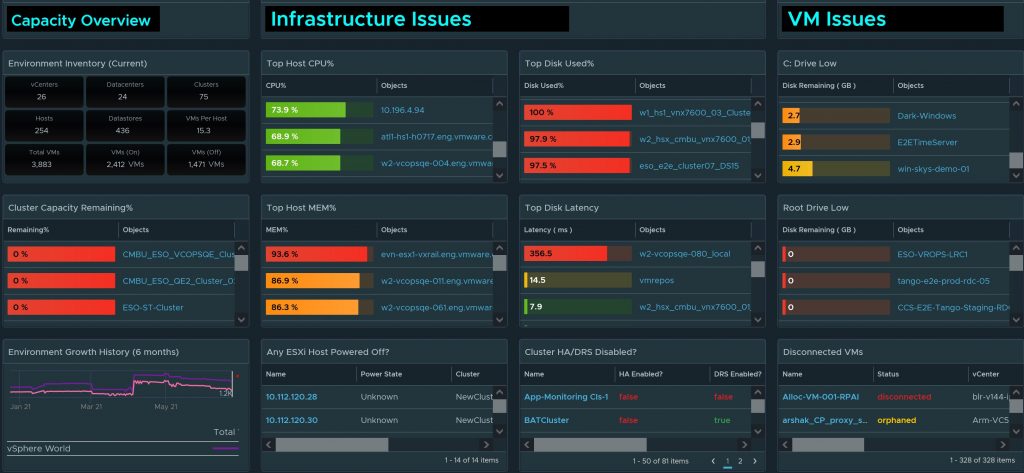
With the new features of 8.4, I was finally able to finish my Executive Dashboard the way I envisioned it.

In this post, I will answer how I personally handle alerting for my customers. Once you install an enterprise monitoring

New in vROPS 8.4 is an Automation Central section. Automation Central allows you to automate task such as rebooting VMs,

In this guide I will show you how you can attach an uptime tag on any VM you like and
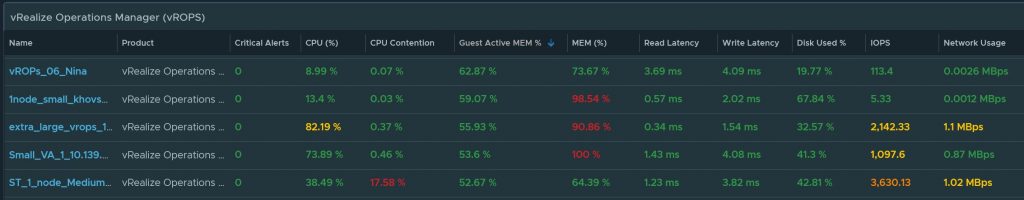
Monitor the performance and configuration of the following appliances: vCenter Servers, NSX, NSX-T, vRA, vROPS, Log Insight, Orchestrator, Life Cycle
My customers ask me this question all the time, how do I monitor services and get alerted on Vmware SDDC

In this guide I will show you how to enable hidden metrics using vROPs 8.0 and above. There are over

First thank you everyone for making this the number 1 most downloaded dashboard on Vmware code. Also, a big thanks

The new vCenter Inventory is even more complete than the last one. In one click you can get a complete

Now with the new release of vROPS 8.2, backing up all your content is now easier than ever before. In
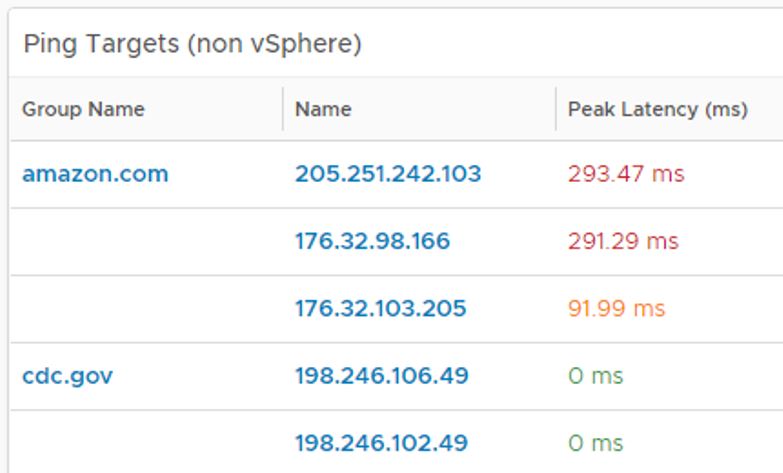
The ping adapter allows you to ping and monitor any IP address, almost any DNS names, a complete subnet, or
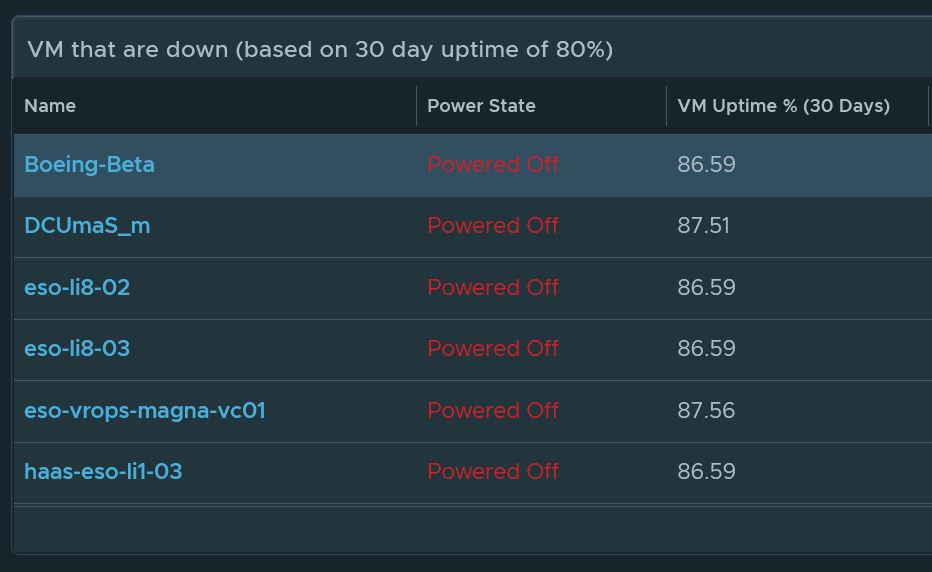
The VM uptime dashboard will keep track of any VMs that are currently down but has an uptime of more
Personally, Virtual Machine uptime is the hardest metric to calculate and create by far. Luckily, my co-worker Iwan has already

Every time I walk into a new engagement with a Fortune 500 company, I always ask the customer the question