Download – Aria Operations Windows Server Checker Dashboard
Windows Server 2012 R2 has now reached end of life on October 2023. Which means free updates, bug fixes, and technical support for the OS has ended. Microsoft has allowed customers to purchase Extended Security Updates until 2026. With that being said, I have created this dashboard to easily check which environment still has Windows 2012 server and below in just one click of the button.
Download Dashboard here
https://developer.vmware.com/web/dp/samples?id=6554
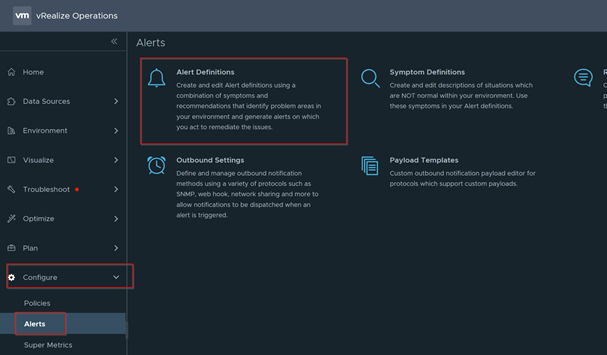
User Guide
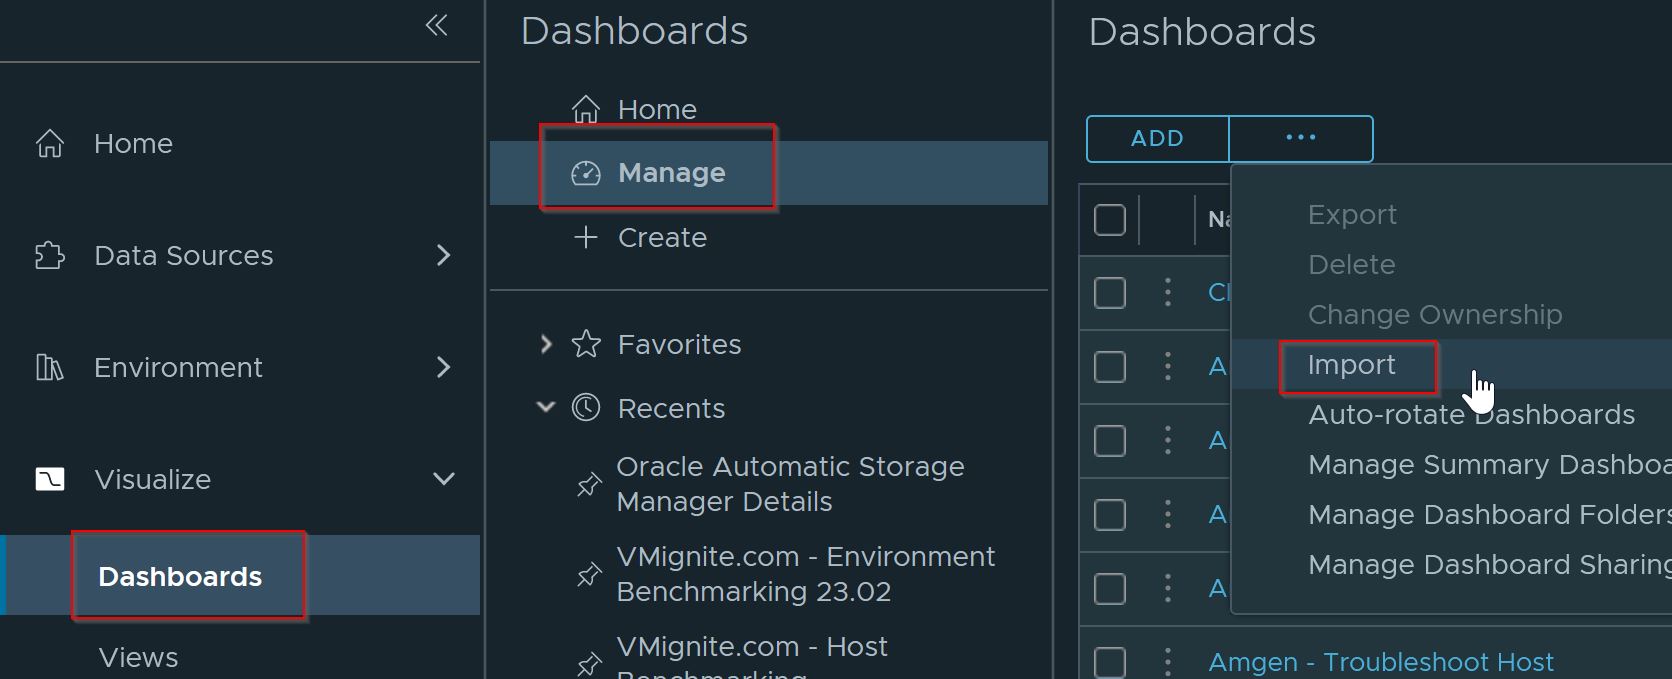
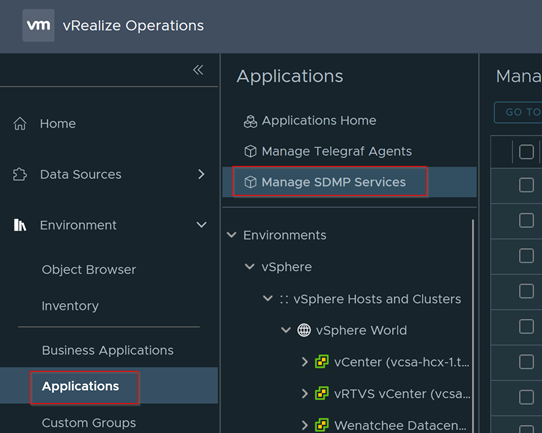
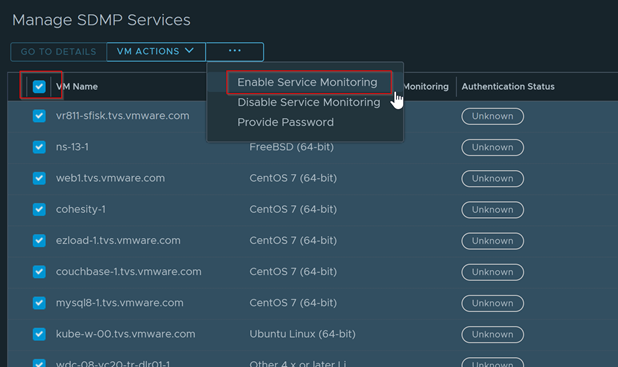
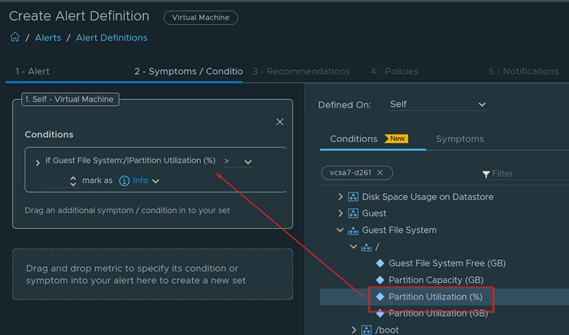
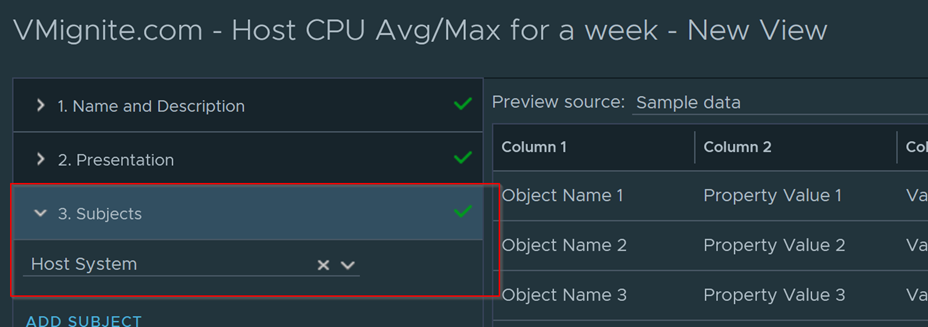
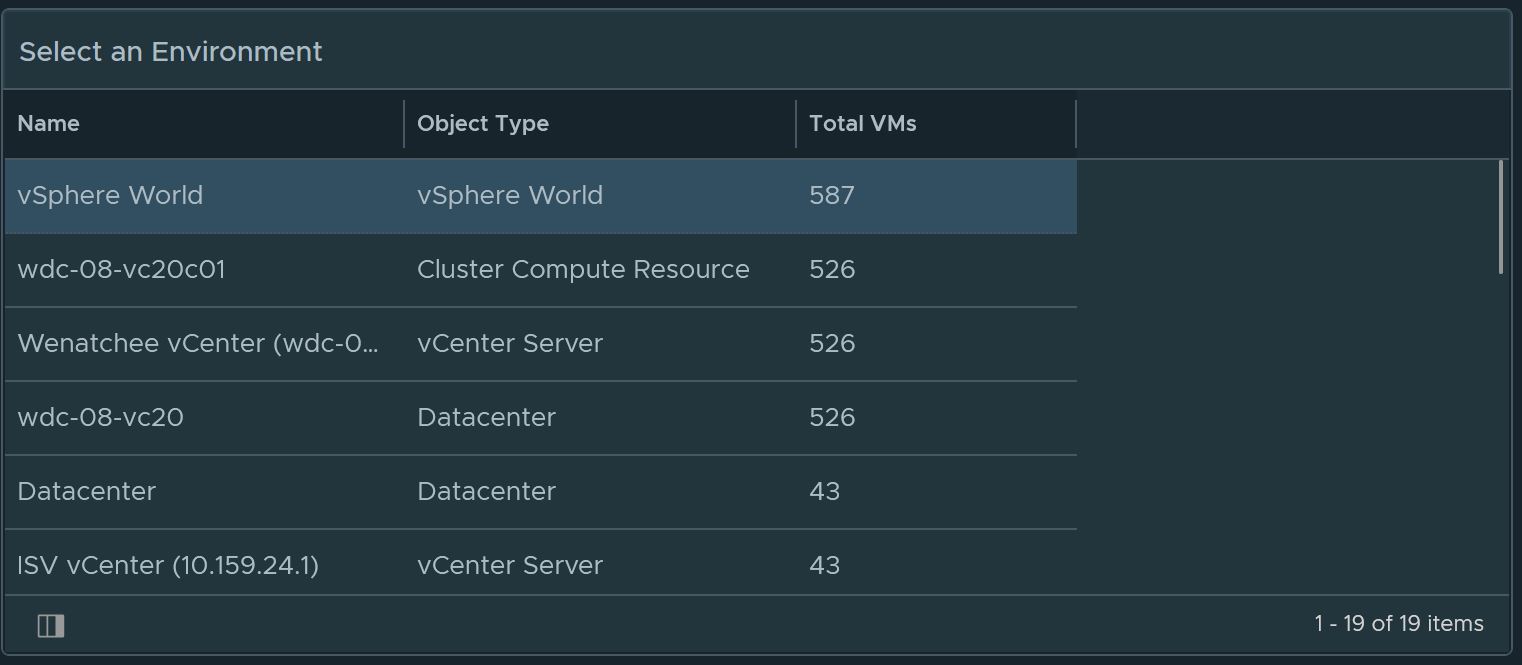
Select an Environment to do a Windows Check. Select vSphere World to search for all environments.
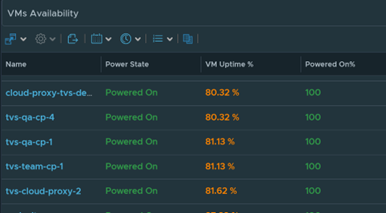
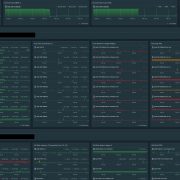
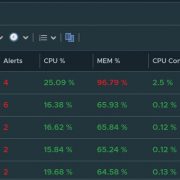
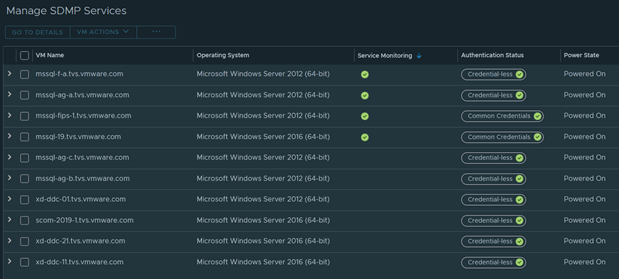
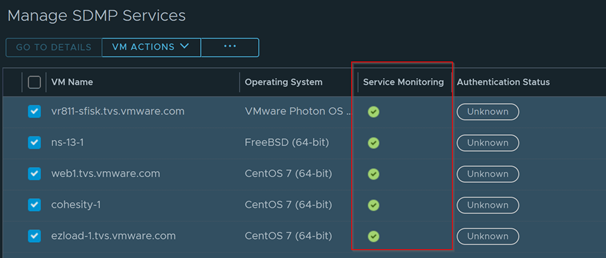
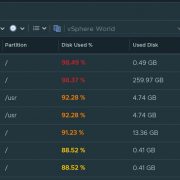
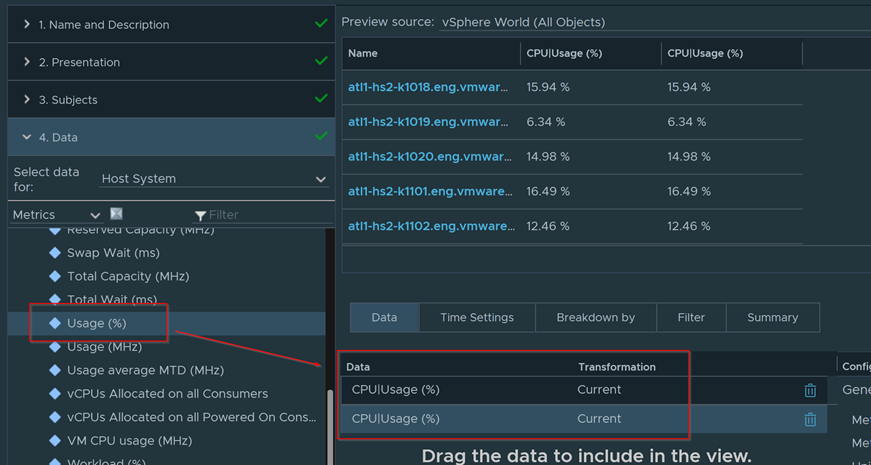
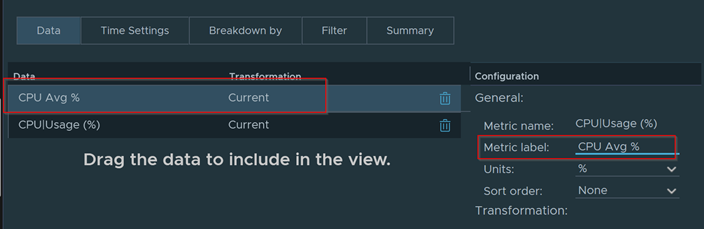
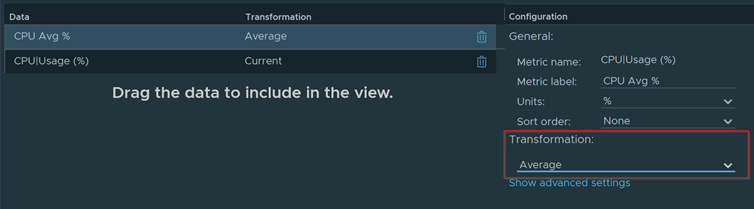
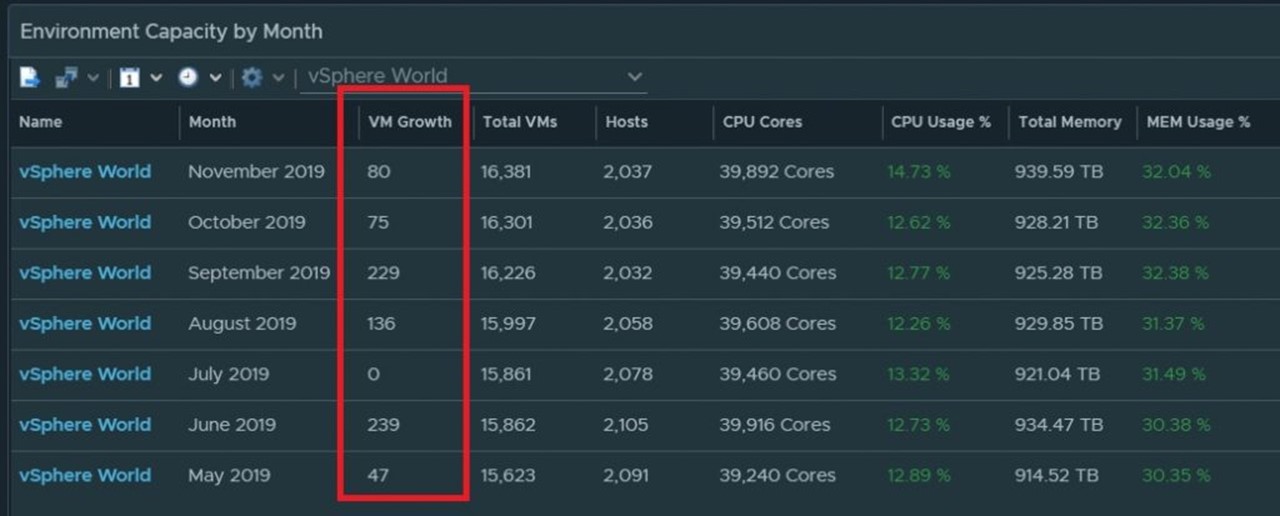
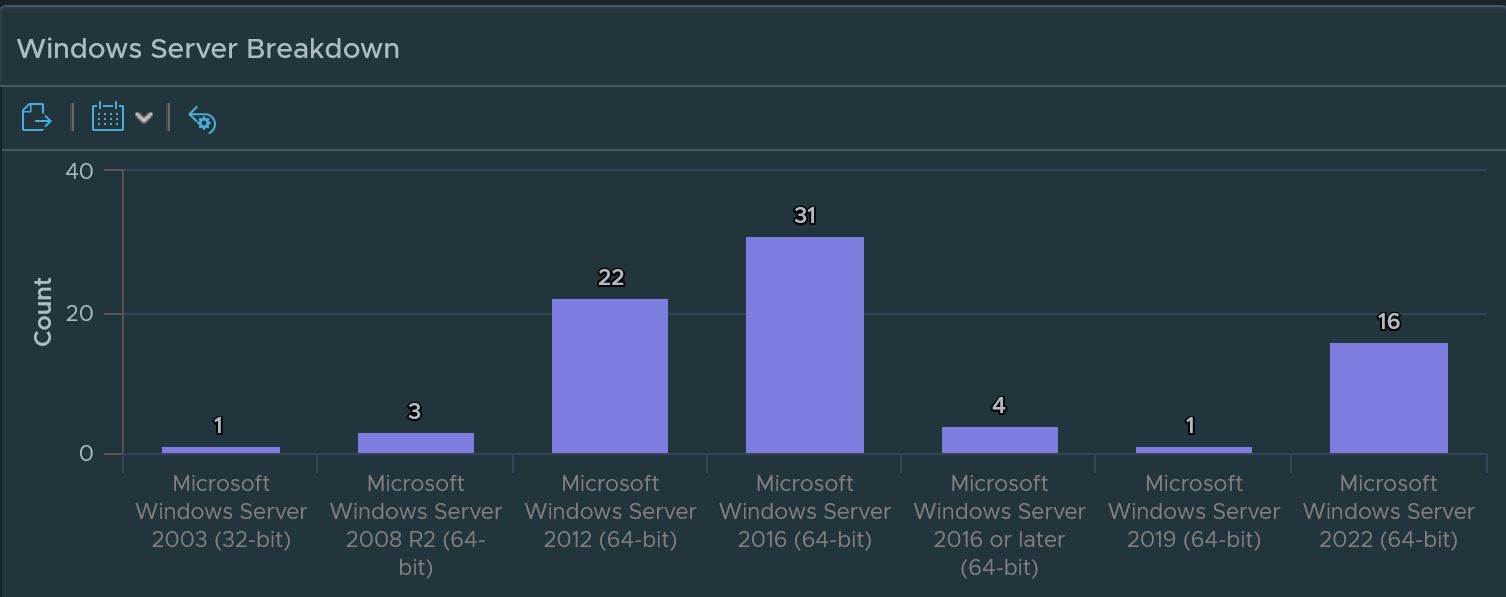
Get a nice breakdown of all Windows variants in the environment.
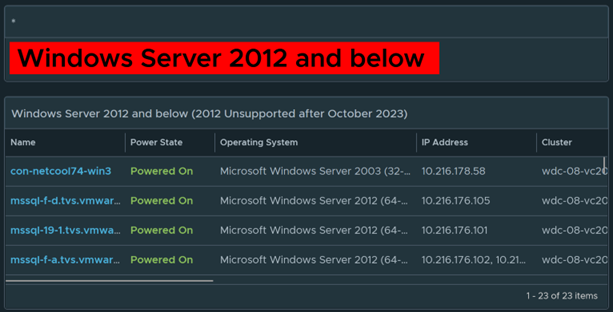
Anything in this column are Windows 2012 and below
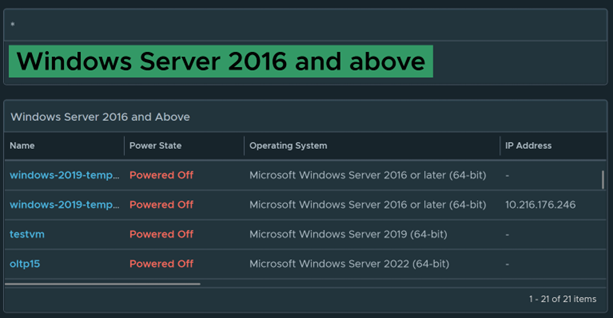
Anything in this side are Windows 2016 and above
Download Dashboard here
https://developer.vmware.com/web/dp/samples?id=6554