
Update – vSphere Complete Health Check Dashboard for vROPS v1.1
Added more enhancements to my vRealize Operations Manager vCenter Health Check Dashboard. Just select a vCenter, Cluster, or Datacenter and […]
Added more enhancements to my vRealize Operations Manager vCenter Health Check Dashboard. Just select a vCenter, Cluster, or Datacenter and […]

In this guide I will show you how to create your own custom health metric based on criteria that you

vROPS 7.5 has too many features to even mention in greater detail. Since I can’t cover them all, I will
One click and you can analyze everything wrong with your current vCenter Environment! From physical hardware issues, VM performance and

All ESXi Host attached to a specific cluster should have the same amount of datastores connected to it. This is

One of my favorite new features of vROPS 7.5 is the ability to filter data from almost every widget. In
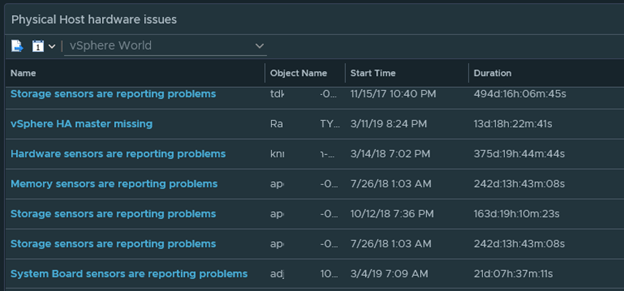
The purpose of this dashboard is to capture all the important issues with Physical Host Hardware, host network availability, storage

Out of the box, vROPS does an amazing job collecting Physical Host alerts. By default vROPS collects host fan sensor
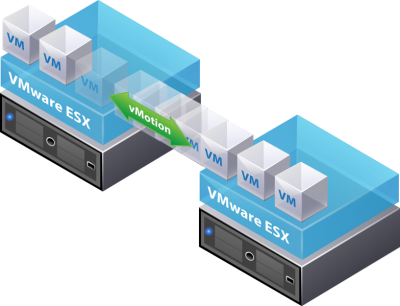
This guide is written for those who need all methods of migrating, cloning, cross vMotion, and just moving a VM

The Expression feature that is located in the View Widget will allow you to create a simple formula using the
I don’t share out any advance dashboards on my blog, mainly because all my advances ones I keep exclusively to

Here is another hidden gem inside of vROPS that many of my customers don’t even know about until I show

Having slow Windows logon times and need to find out what is causing it? The Vmware Logon Monitor fling will
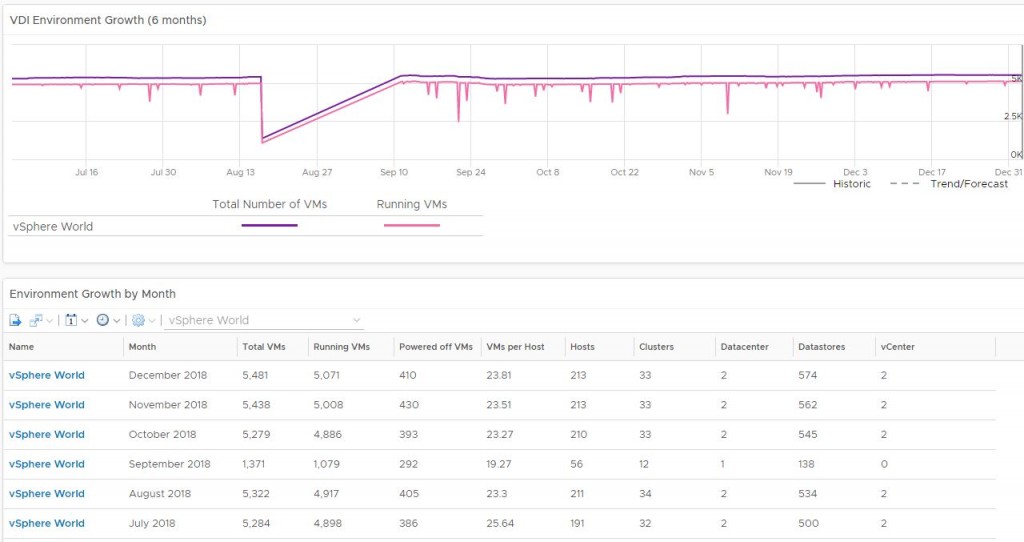
Here is my latest enhancement of the Environment Growth Dashboard. This dashboard allows Engineers, Operators, and Managers to view growth
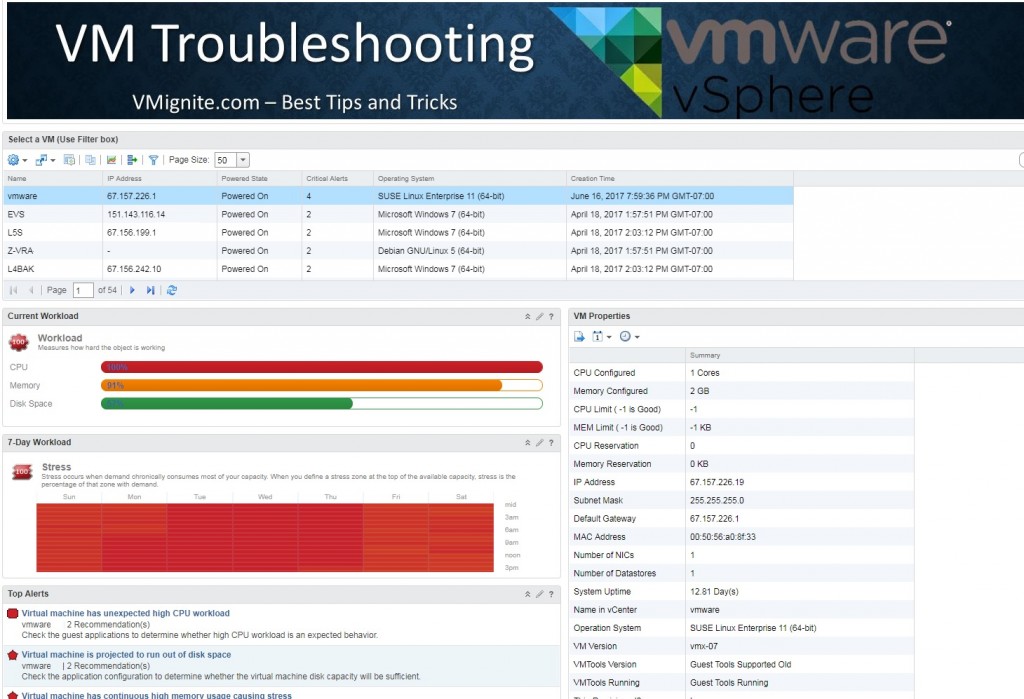
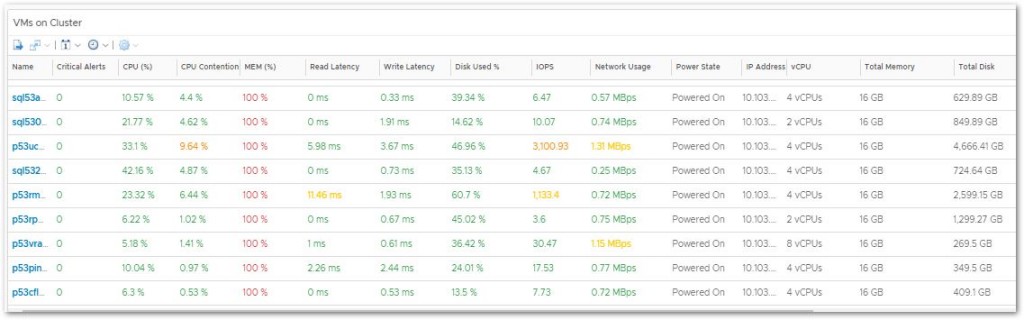
I have updated the VM Troubleshooting Dashboard for up to Version 7.0. This is a must-have dashboard for any environment