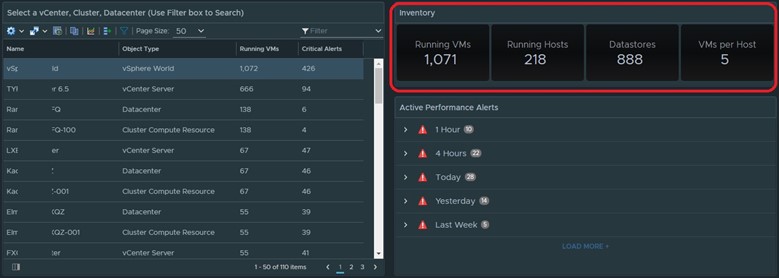
Added more enhancements to my vRealize Operations Manager vCenter Health Check Dashboard. Just select a vCenter, Cluster, or Datacenter and let the dashboard show you over 50 things wrong with your environment. Feel free to comment on anything else you would like to see added to improve the dashboard. Below are details of the update.
Now when you select a vCenter, Dashboard, or Cluster you will see an inventory of it on the right side.

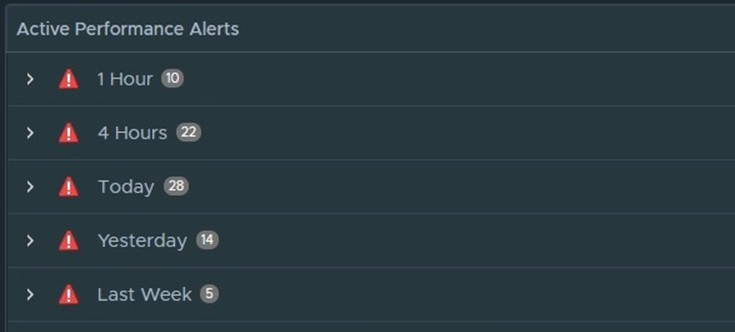
Also added Active Alerts as well, but I filtered them to show only Active, Critical, and Performance alerts only. This leaves out a lot of bloat and makes it more useful.

Download on VMware Code Exchange Here https://code.vmware.com/samples?id=5639#
Works for vROPS 7.0 and above for best performance. I haven’t tested in with any versions below that.
Hi Lan,
This is an excellent dashboard, will you be able to add objects (e.g. HOST, Vcenters, datastores etc) in a square or pie chart with colours ( green for no alert, orange for warning etc), displaying number of issues per object type, to show a very high level view of environment. And by clicking that object we enter into more detailed information about those alert description like the one already available in table view for each object type.
Yes an overview can be created but involves numerous supermetrics to be created. I wanted to make this dashboard easily importable hence why the use of Supermetrics was not used. This dashboard has been enhanced a lot since then, will post an update at a later time. Thanks for the compliments.
Thanks Lan, appreciate it