In this post I will show you how to use the Instance Breakdown feature to get more granular detailed metrics. For example, out of the box it is easy to see the overall CPU usage % from a VM. However, what if you wanted a breakdown on how much CPU usage % each individual core of the VM was using. In this example I will show you how to use this feature to display all the partitions of a Virtual Machine and display how much space each partition is using. Doesn’t matter if it is a Linux or Windows box, we will create a dashboard that will automatically populate partitions that belong to that Virtual Machine. Credit goes out to Robert and Vahan.
In the following steps we are going to create a view widget that will automatically detect what drives are on that VM and will display how much space is used.
Go to Dashboards > Views and add a new one
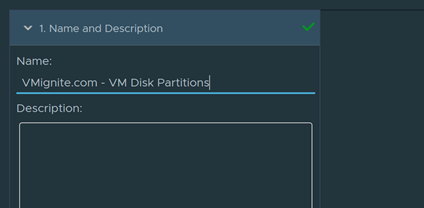
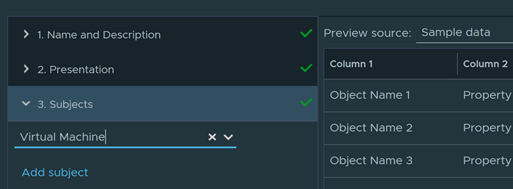
Provide a Name for our View
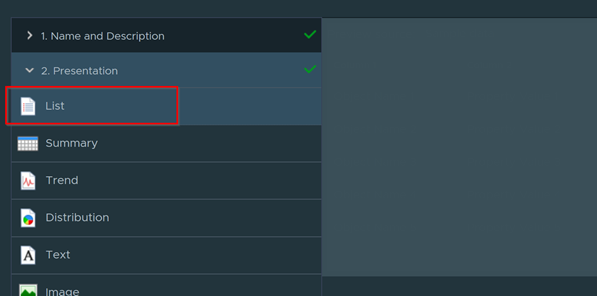
Under Presentation, select a List since we want everything listed out for us
Since we are looking for Virtual Machine metrics, select Virtual Machine as the subject
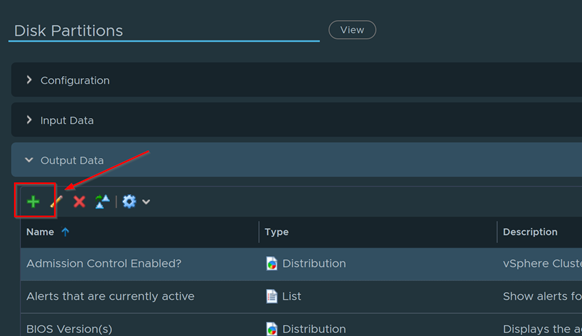
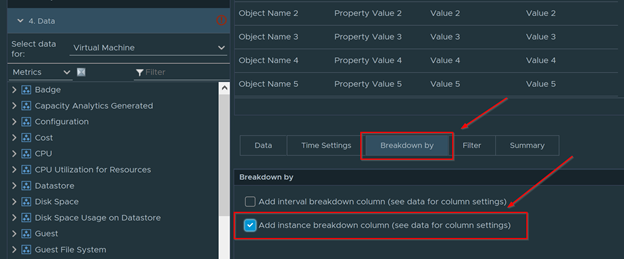
Next click on the Breakdown by tab and check the box Add instance breakdown column
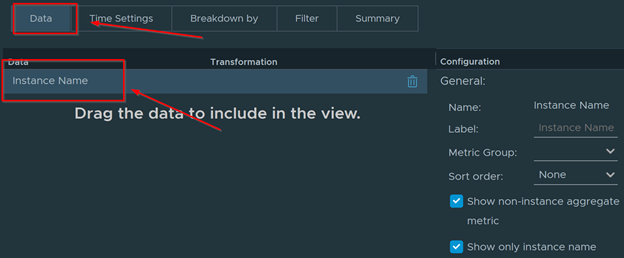
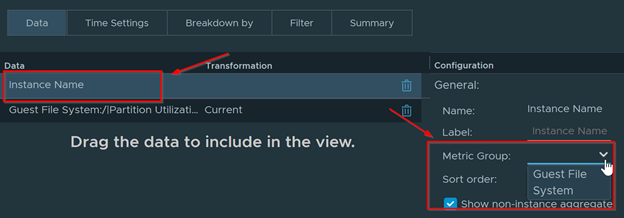
Now click on the Data tab and you should now see Instance name show up. We will need to configure the Metric Group, but for now we are not able to until we add a metric so that it can correlate to.
On the left-hand side, double click on Guest File System > / > Partition Utilization % until you see it on the right side.
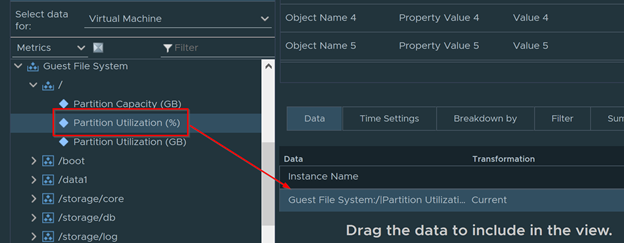
Now that we added a metric that has many sub-categories, we can now configure our Metric Group. Click on Instance Name and select the Guest File System under Metric Group.
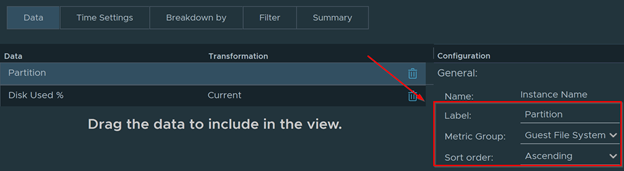
To make our output look better, type in Partition next to the Label box. Since one Virtual Machine can have many file partitions, lets sort it by Ascending so it looks easier to read. For example, if a Windows VM has a C, D, and E drive we would like to view it in that particular alphabetical order rather that randomly such as (E, C, D)
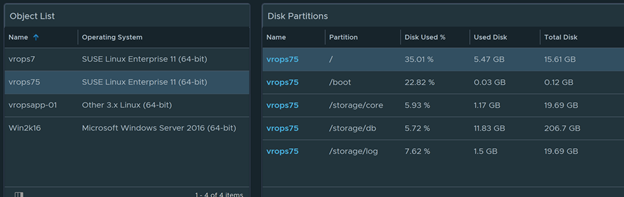
Click on Save. We can now use the View we created and add it to a dashboard with an Object selector. In the bottom example, I selected a Linux box in my Object List and it displayed me all the file partitions for that Virtual Machine.
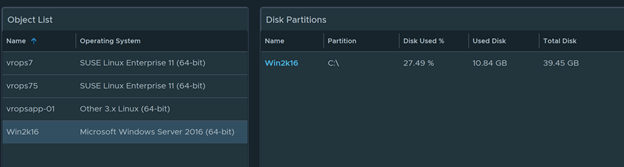
When I selected a Windows VM, it showed me only the partitions for that Virtual Machine
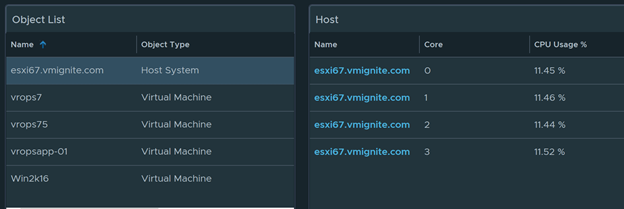
You can also use this guide to see a breakdown of vCPU cores, multiple IP addresses, etc. In the bottom example I broken down the CPU Usage by Core of a Host.