The following steps will allow you to create a view that displays the average CPU and the maximum CPU peak point for Host in a week. We will also add a summary to the list as well.
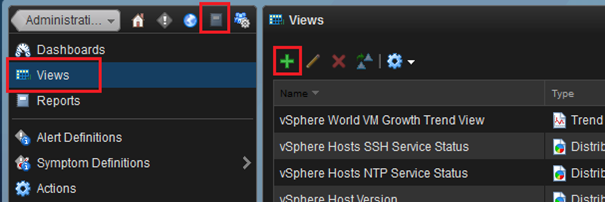
- Click on Content > Views > + sign
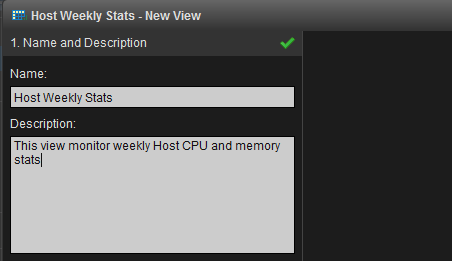
- Enter a name
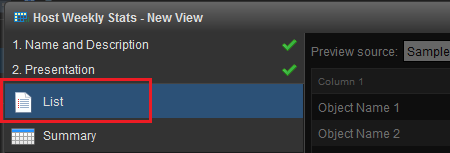
- Click on Presentation and select List
- Click on Subjects and then
select vCenter Adapter > Host System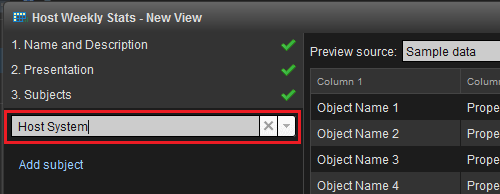
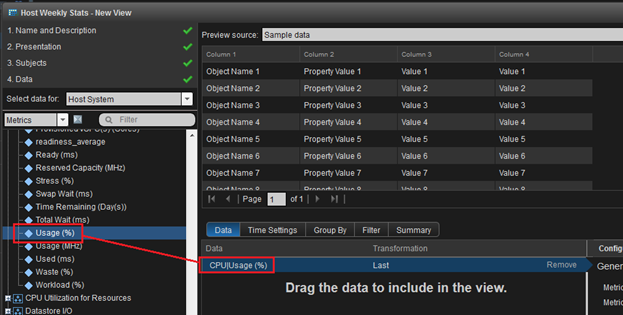
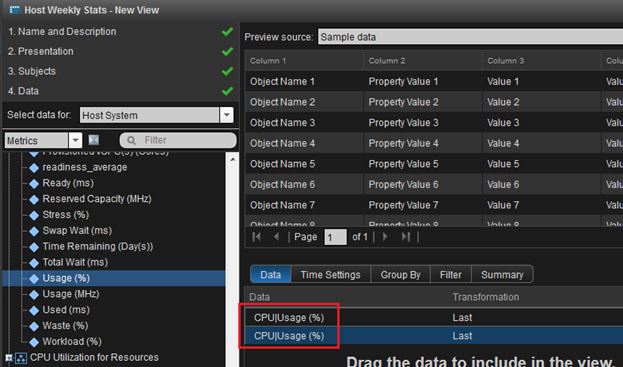
- Click on Data
- Expand CPU and double click on Usage (%) until it appears in the Data box
- Double click on Usage (%) again until you see two of them
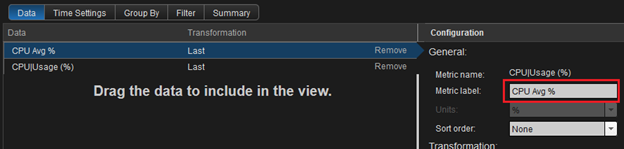
- Select CPU|Usage (%) and change the Metric label to CPU Avg % (this will change the display name of the Data)
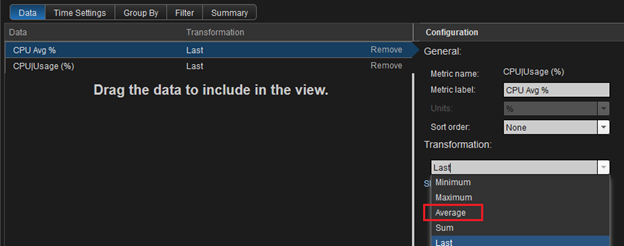
- Change the transformation to Average
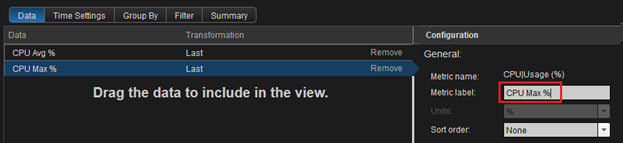
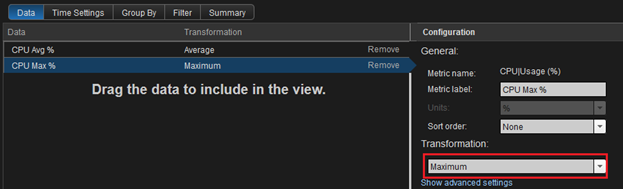
- Select the other CPU|Usage (%) and change the metric label to CPU Max %
- Change the transformation to Maximum
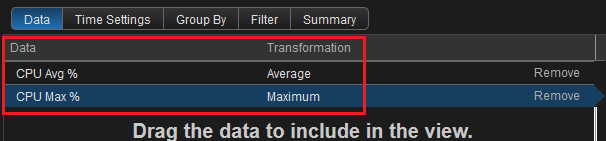
- Notice how the Data has changed accordingly
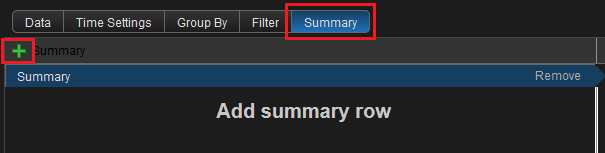
- Click on Summary Tab and click on the + sign to add a new summary
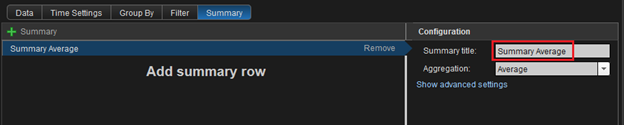
- Highlight the Summary and change the title to Summary Average
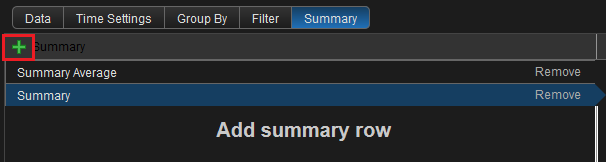
- Click on the + Sign again to add another Summary
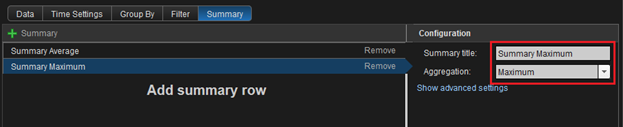
- Select the Summary and change the summary title to Summary Maximum. Change the aggregation to Maximum
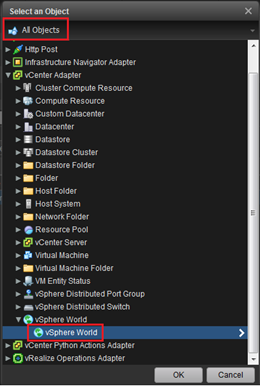
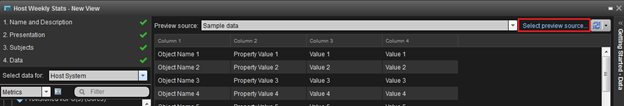
- Now let’s see a preview of what our view will look like. Click on Select preview source
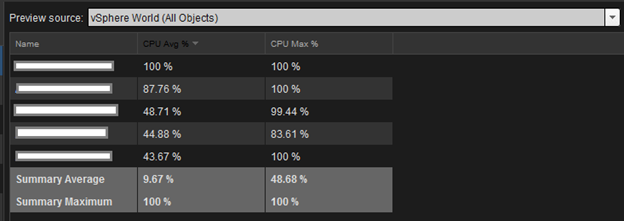
- Select All Objects > vCenter Adapter > vSphere World > vSphere World to view all Host in all vCenters. Click on OK
- Notice the Summary we created on the bottom
- Click on Save, the view is now ready to be added to a dashboard