Download – VMware Inventory Dashboard for vROPS 7.0+
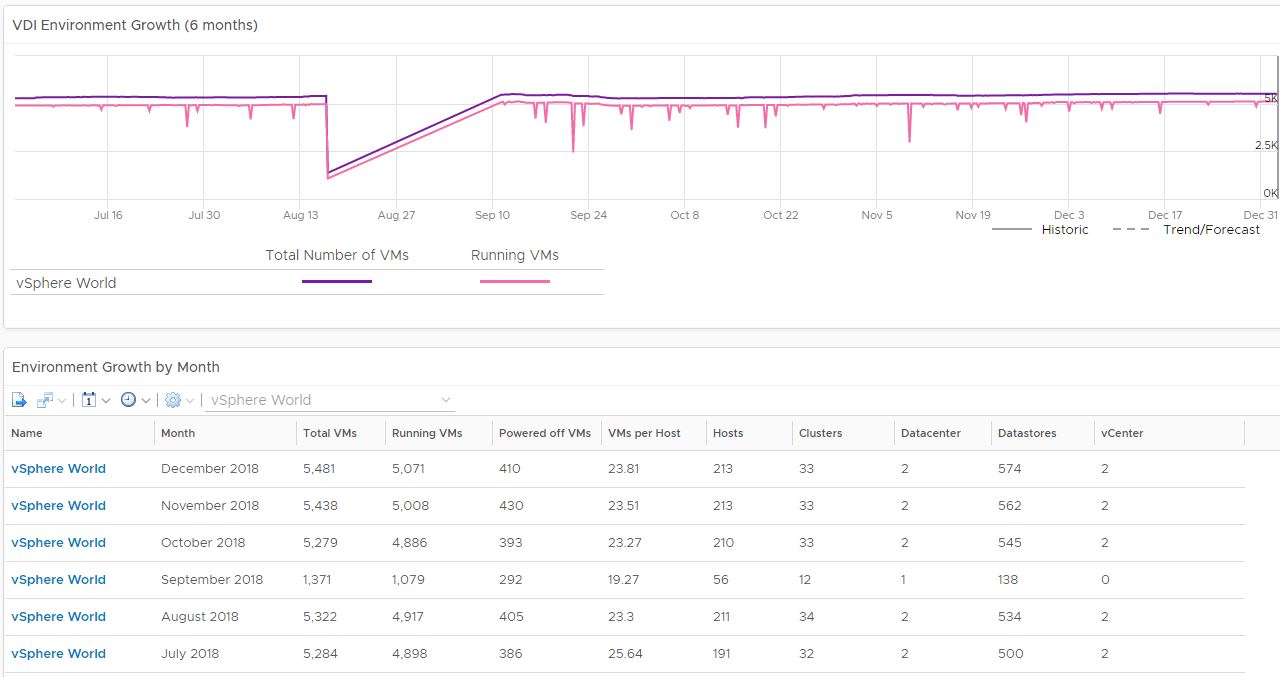
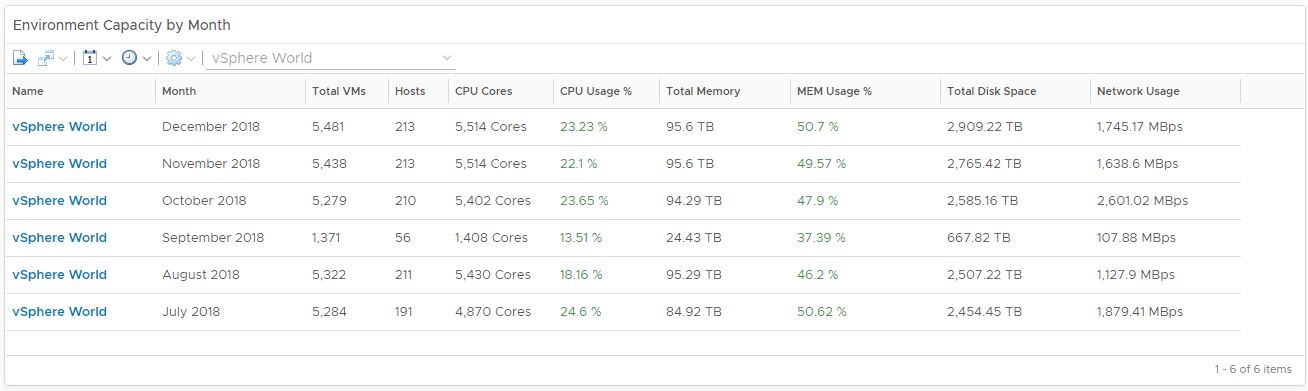
I don’t share out any advance dashboards on my blog, mainly because all my advances ones I keep exclusively to my customers. I had to think a few times before I decided to share out this particular dashboard because of all the work I put into it. Here is another must-have dashboard that monitors all VMs, Hosts, vCenters, and Datastores in your environment. The performance metrics alone are worth the download by itself. As an added bonus, on the bottom of the dashboard there is a display that shows all the latest VMs, Hosts, Datastore, etc collected. Features of the dashboards are highlighted below
Note: Only download if you have vROPS 7.0 or above!
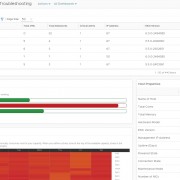
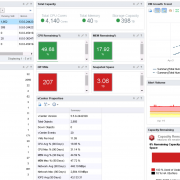
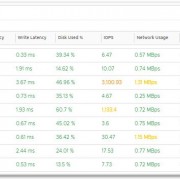
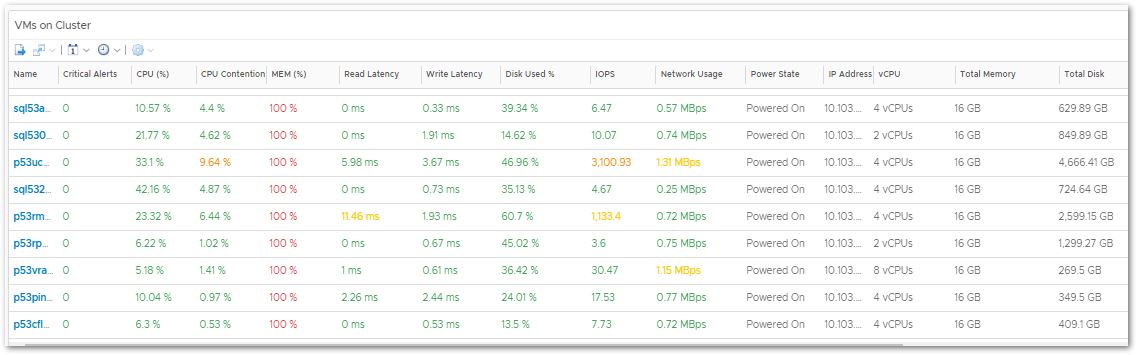
All Performance Metrics are color coded and each can be sorted
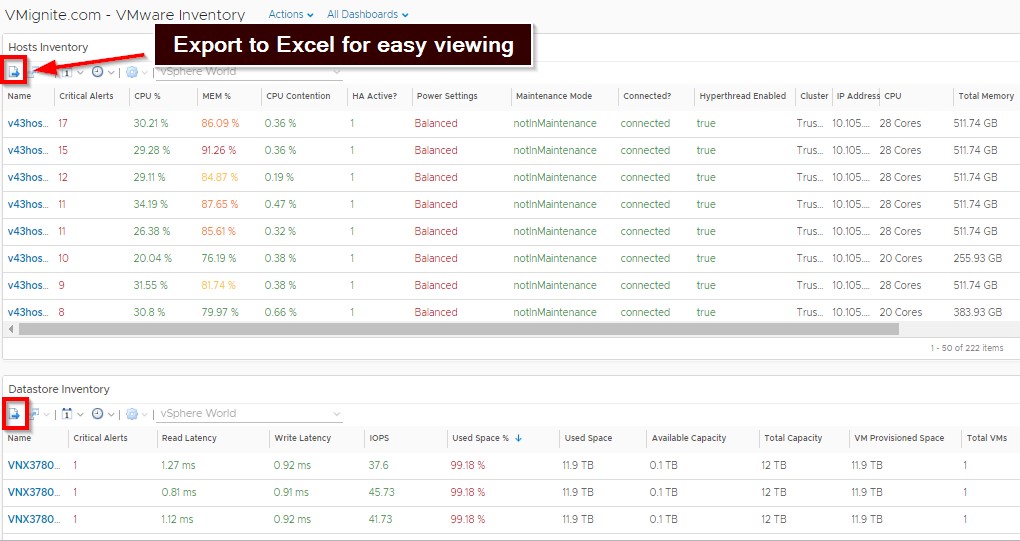
Click on the Export button to export to Excel
Scroll to the bottom to see Total and Averages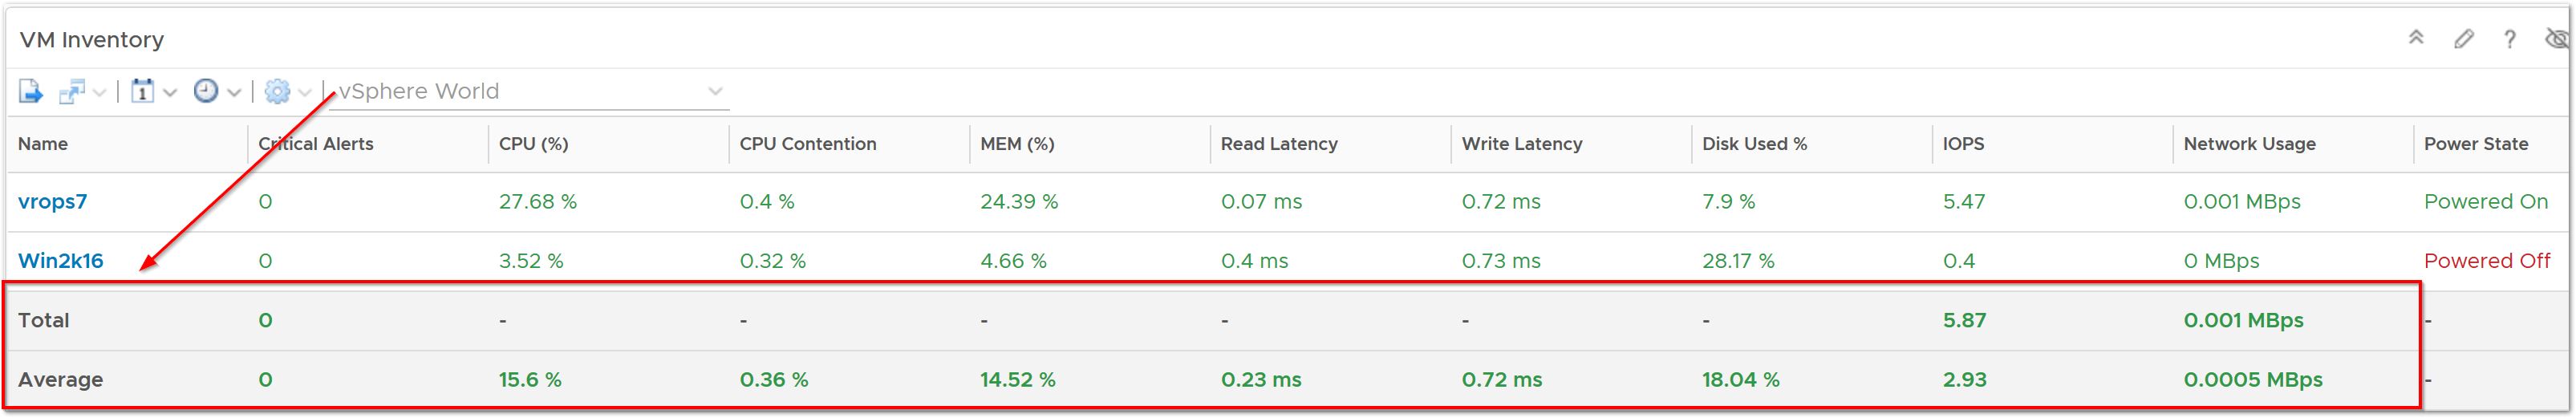
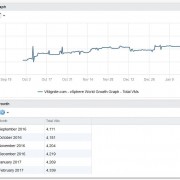
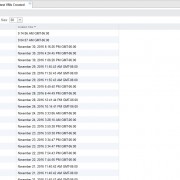
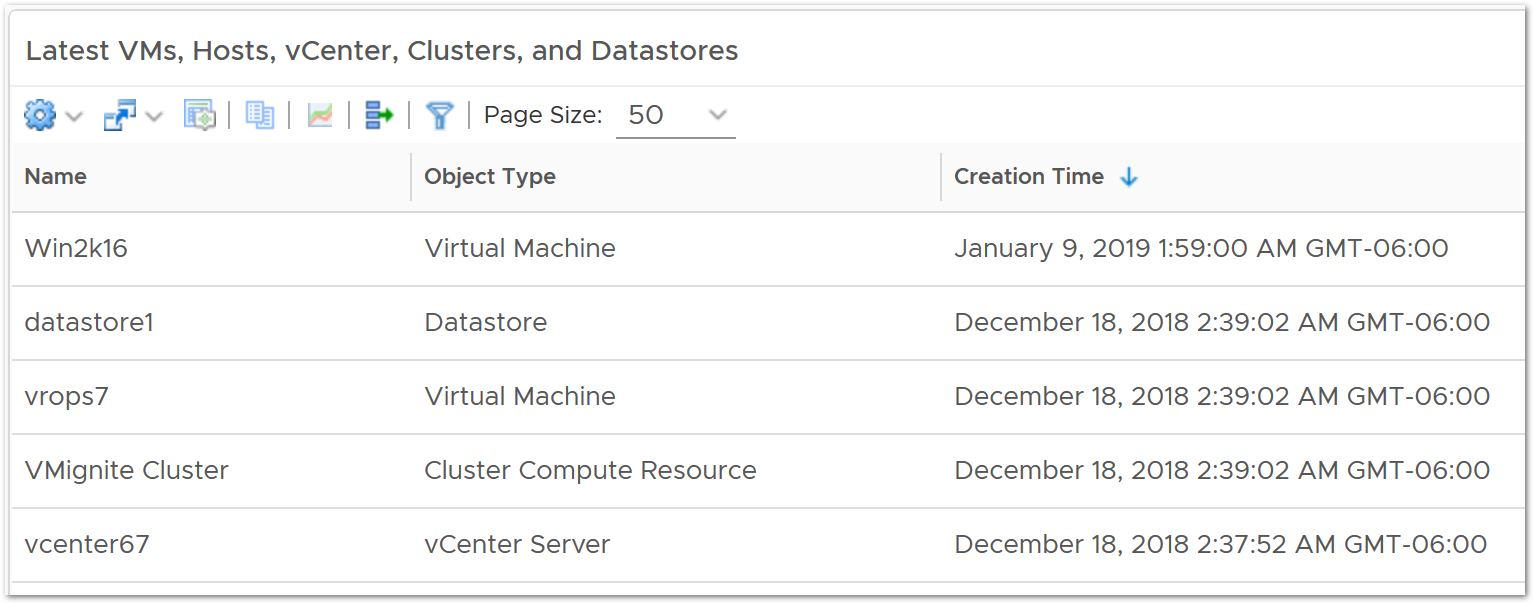
View the latest VMs, Datastores, Hosts, and vCenters collected
Download here > VMware Inventory Dashboard (2124 downloads )
To import in version 7.0 and above
-
First unzip the file you just downloaded, it will contain a dashboard and a view file
-
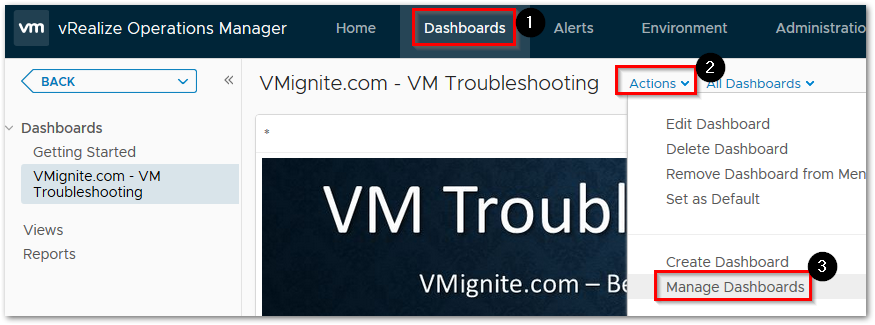
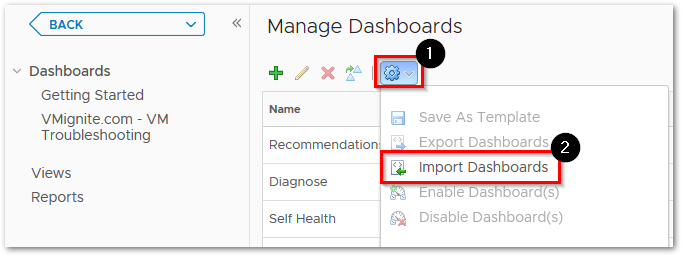
Go to Dashboards > Actions > Manage Dashboards

-
Hit the dropdown and select Import Dashboards. Import the Dashboard.zip file
-
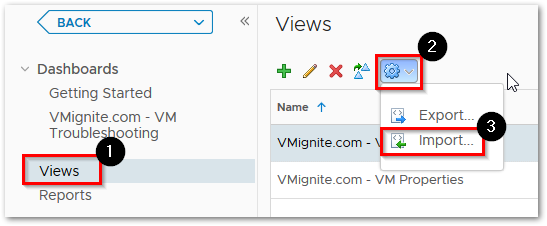
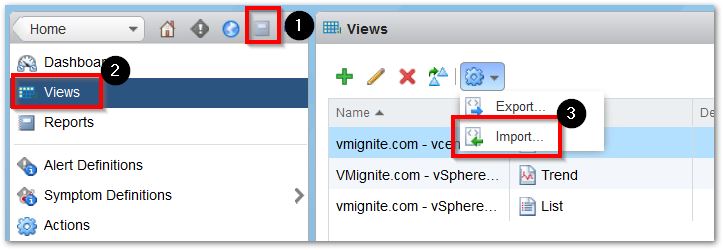
Next to go Views > Dropdown > Import. Import the View.zip file