Here is the first of many must-have dashboards to come: the VM Troubleshooting Dashboard. I am starting a new series called Maximize IT. The goal is simple, create must-haves dashboards that every company needs now to maximize IT operations. The latest version of vRealize Operation Manager 6.6 comes with some great enhanced out of the box dashboards. Here is an alternative version of the VM Troubleshooting dashboard. Also make sure to download the VM Troubleshooting guide as well, as it will show you step-by-step on how to use the dashboard to troubleshoot a VM. To learn more about the default vROPs 6.6 troubleshooting dashboard, view Sunny Dua’s blog here
- Troubleshoot VM Issues quickly by identifying root cause analysis
- View the history of when the problem started
- View all the VM Properties
- View what is connected to the VM
vROPs Version 6.0 – 6.5 Download Here VM Troubleshooting 6.5 (3329 downloads )
vROPS Version 6.6 Download Here VM Troubleshooting Dashboard 7.0 (6575 downloads )
Troubleshooting Guide Download Here VM Troubleshooting Guide (5248 downloads )
To import in version 6.6
-
First unzip the file you just downloaded, it will contain a dashboard and a view file
-
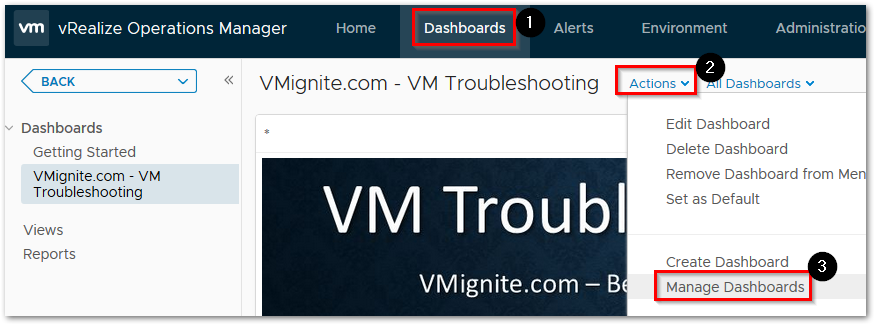
Go to Dashboards > Actions > Manage Dashboards

-
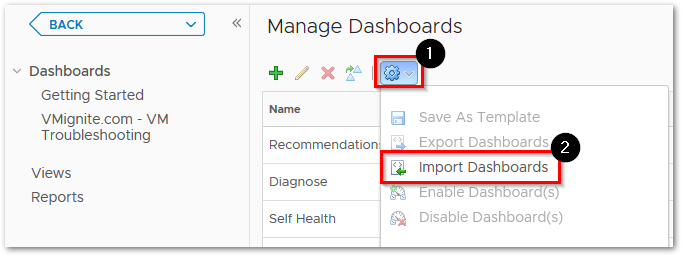
Hit the dropdown and select Import Dashboards. Import the Dashboard.zip file

-
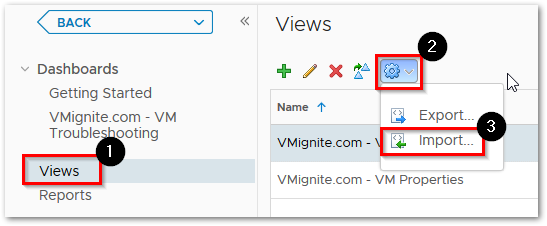
Next to go Views > Dropdown > Import. Import the View.zip file

To import in version 6.x
To Import the dashboard go to Content > Dashboard > Import Dashboards
and import Dashboard.zip file

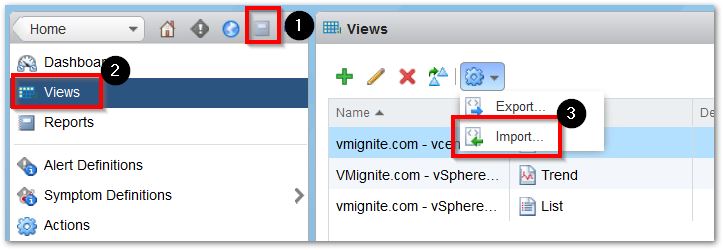
To Import the views go to Content > Views > Import
and import Dashboard.xml file
