Download – VM Uptime Dashboard for vROPS 8.2+
The VM uptime dashboard will keep track of any VMs that are currently down but has an uptime of more than 80% of the time for the last 30 days. A production VM should be up a majority of the time, therefore giving an uptime of over 80% for 30 days will eliminate a lot of VMs that are used for temporary testing, powered off majority of the time, VM templates, etc.
(Note you must have vROPS 8.2 for this to work)
Instructions
- You will need to install and active the uptime supermetric which you can download here first https://code.vmware.com/samples?id=7421
- Next download and install the dashboard and view here https://code.vmware.com/samples?id=7476
User Guide
-
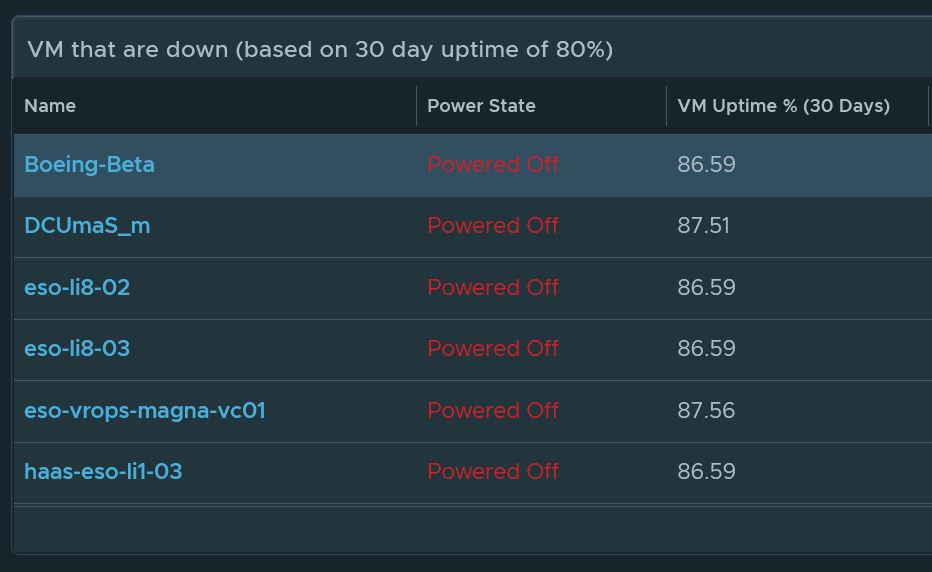
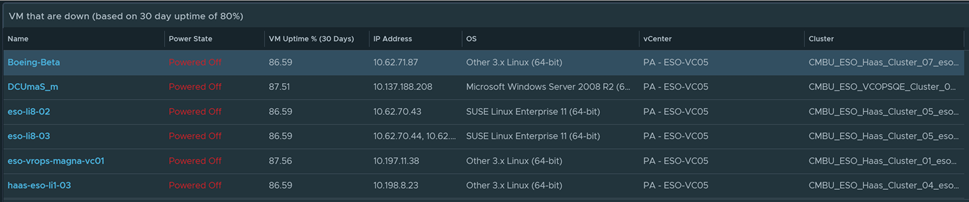
If any production VMs are down you will see it listed here. As you can see in the sample, the VMs are currently in a Powered Off State and the VM has a high uptime in the last 30 days.
-
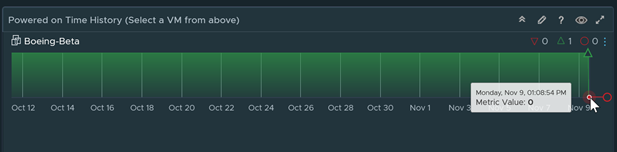
Select any of the VMs and you will see the uptime history in the graph below it. Use your mouse to hover when it went down to see exact dates and time when it went down.
How to Install the dashboard
To import in version 7.0 and above
-
First unzip the file you just downloaded, it will contain a dashboard and a view file
-
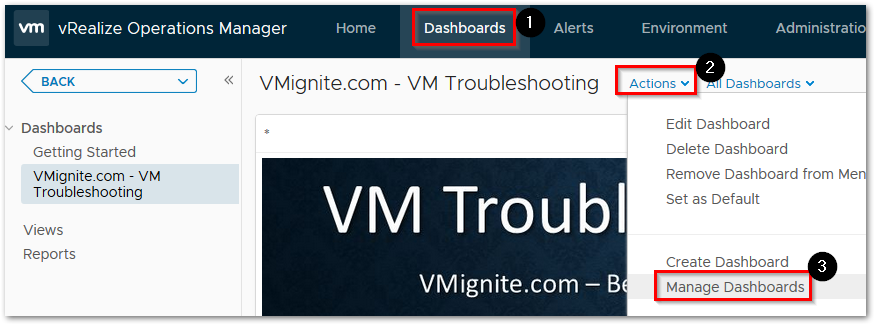
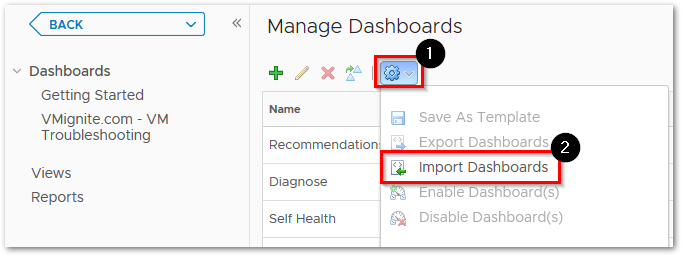
Go to Dashboards > Actions > Manage Dashboards
-
Hit the dropdown and select Import Dashboards. Import the Dashboard.zip file
-
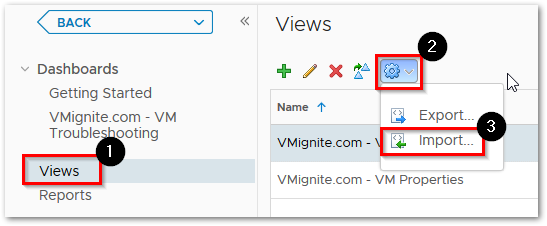
Next to go Views > Dropdown > Import. Import the View.zip file
Do I need change any setting to get this dashboard working?
I followed the instruction, no luck!
Did you activate the uptime
Metric in the policies?
Yes. Enabled the super metric VM Uptime to Default Policy .
Thanks for all your help..
Make sure that is the active policy. In the Policy screen look for any active policies and make sure they are activated for all those policies that shows up on that screen. Especially the policy that has a D next to it.
Dashboard is working. Thanks..
Can we trigger an alert from this action and email be sent to server owners?
Not using this method. For this you will want to use the ping pack. Ping any server you want http://www.vmignite.com/2020/12/2123/
Hola acabo de probar el dashboard, apague una VM y me la registro pero pasado unos 5 minutos no aparece la maquina que apague, debo cambiar algo?
Thank you for the Dashbord, it working as expected.
Were you able to get the Alerting part working as well, i have tried many options and was unable to get the same result as dashboard?
I am using 8.4 in my Lab.
You can use this method to get alerts on VMs you want to measure up/down http://www.vmignite.com/2021/05/vrops-how-to-monitor-vm-uptime-using-vsphere-tags/