

How to monitor and troubleshoot slow Windows Logon Time
Posted in Windows
Having slow Windows logon times and need to find out what is causing it? The Vmware Logon Monitor fling will capture important logon metrics such as Total Logon Time, Session Logon Time, Shell Load Time, Group policy Time, and more so you can quickly troubleshoot what is causing the slowness. Best of all it is a free tool, it is simple to use, and simple to install. You can also configure it to send logs to a remote server. By default, it keeps up to 10 logs and rewrites itself. The functionality of this Fling is included by default with Horizon 7.1, just use this guide to find the path on where the logs resides.
-
Download the installer from https://labs.vmware.com/flings/vmware-logon-monitor
-
Copy the installer file to the server you want to monitor

-
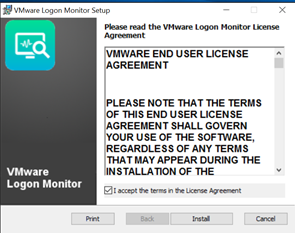
Run the install and accept the license and click on Install
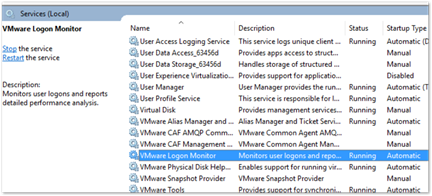
- You can verify that the Service is running and startup type is set to Automatic
-
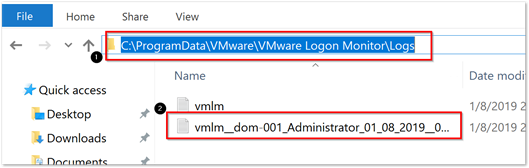
Now logoff the server and log back on. Go to C:\ProgramData\Vmware\Vmware Logon Monitor\Logs and double click on vmln_* file to view the logs
-
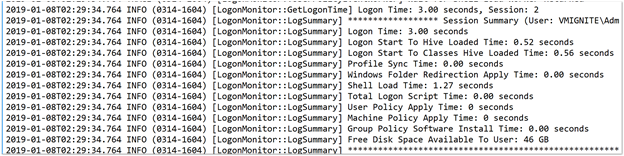
Scroll to the bottom and you can see some useful logon time metrics.
- Here is a list of the metrics it collects
| Metric | Description |
| Logon time | Metrics include the time logon starts on the guest, logon is completed and the profile is loaded and the desktop is visible, and the total time spent processing logon on the guest. Excludes any time spent outside of the guest. |
| Session start to logon start time | Time from when Windows created a user session until logon began. |
| Profile sync time | Time Windows spent reconciling user profile during logon. |
| Shell load | Windows provides the start time of the user shell load. The end time is when the explorer window is created. |
| Logon to hive load time | Metrics provide total time from when the logon starts to when the user registry hive is loaded. |
| Windows folder redirection | Metrics related to the time Windows folder redirection starts and is fully applied, as well as the total time to enable Windows folder redirection. This time can be high for the first time folder redirection has been applied or if new files are being uploaded to the redirected share. |
| Group policy time | Metrics related to applying group policy to the guest include the time it took to apply user group policy and machine group policy. |
| Profile metrics | Metrics related to the user profile indicate the type of user profile and whether it is stored on the local machine, on a central profile store, or deleted after logoff. The profile size includes metrics on the number of files, the total number of folders, and the total size in MB of the user profile. |
| Profile size distribution | A count of the number of files in various size ranges in the user profile. |
| Processes started during logon | These values are logged for each process that starts from the time the session starts until the logon is complete. |
| Group policy logon script time | Metrics related to executing group policy logon scripts report total time spent executing group policy logon scripts. |
| Group policy power shell script time | Metrics related to executing group policy power shell scripts indicate time spent executing group policy power shell scripts. |
| Memory usage | WMI metrics related to memory usage during logon. Samplings are takings until logon is complete. Disabled by default. |
| CPU usage | WMI metrics related to CPU usage during logon. Samplings are taken until logon is complete. Disabled by default. |
| Are logon scripts synchronous? | Reports whether group policy logon scripts are executed synchronously or asynchronously to the logon. |
| Network connection status | Reports whether the network connection is alive or disconnected. |
| Group Policy Software Installation | Metrics related to group policy software installation indicate whether the installations are synchronous or asynchronous to the logon, if the installations succeeded or failed, and the total time spent installing software using group policy. |
| Disk Usage For Profile Volume | Metrics related to the disk usage on the volume where the user profile is stored. |
| Domain Controller Discovery | Domain controller related metrics. Error code indicates if there is a failure reaching the domain controller. |
| Estimated network bandwidth | Value collected from Event ID 5327. |
| Network connection details | Values collected from Event ID 5314. |
| Settings that can affect logon time | |
| Metrics from Horizon Agent, Persona Management, App Volumes | VMware products that interact with Logon Monitor report custom metrics in the Logon Monitor logs. These metrics can help determine if one of these products might be contributing in a negative way to the logon time. |